Navigating the Graphmart User Interface
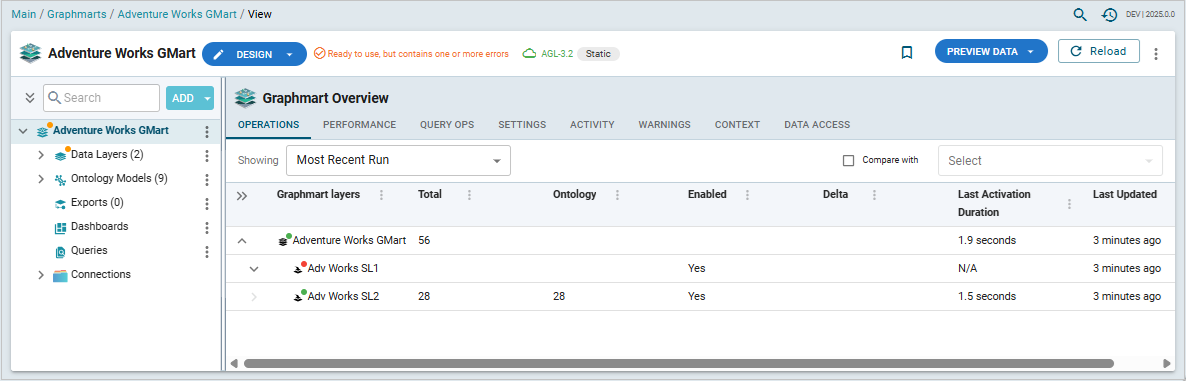
The top-level view of a graphmart consists of two major frames: the explorer pane on the left and the Graphmart Overview frame on the right. This topic describes the graphmart user interface elements in general. For detailed information on the Graphmart Overview tabs, see Graphmart Overview.
-
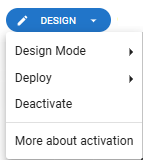
The header bar includes the controls for switching the graphmart modes (Design/Deploy/Deactivate), loading preview data vs all data in the Design mode, and reloading all graphmart layers.
The menu (
 ) on the right-hand side of the bar provides access to the Profile Data, Find Connections, Export, Add to Migration Package, Version, and Sharing features. Note that Sharing allows setting access control on the graphmart's configuration, not permissions controlling data access within the graphmart
The header bar also serves as a status bar providing notifications of errors during reloading or refreshing. The version of that the graphmart is connected to is shown in the middle (for example, AGL 3.2).
-
The explorer pane on the left-hand side shows the graphmart components in a tree structure, where the graphmart item is at the top, and its components - data layers, steps, ontology models, exports, dashboards, queries, and connections - are underneath it. Click the arrows to the left of the components in the explorer pane to expand them and work with the items underneath. As you traverse the tree and click the components and their sub-items, the composite frame on the right shows the relevant views for the selected item
For example, the following composite frame is displayed when an ontology model is selected
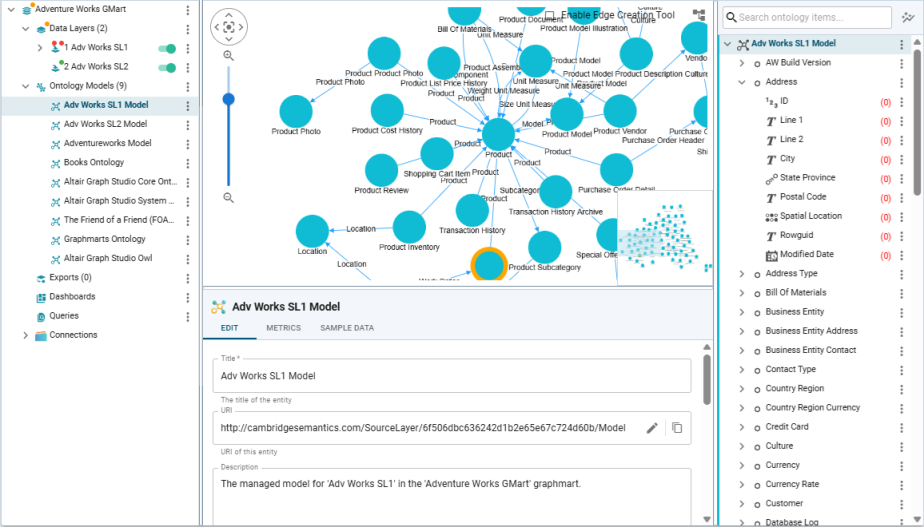 :
:
-
Use the Search bar to quickly find graphmart objects whose name contains a specific string.
-
Use the Add menu to the right of the Search bar to add a new source or transformation layer, a new endpoint or query.
-
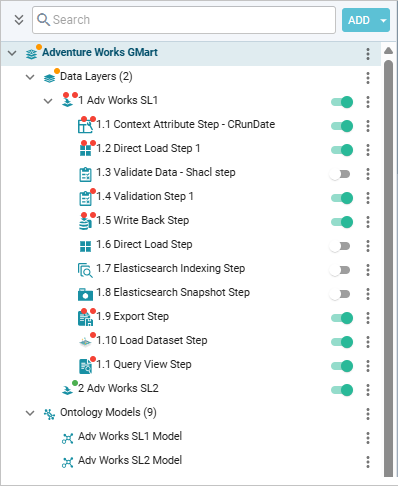
Where applicable, the slider control to the right of the items allows you to enable or disable them. For example, use sliders to enable or disable individual steps underneath the layers in the explorer pane:
-
The menu icon (
) to the right of each item provides access to the context menu for this item type. The context menus for each level are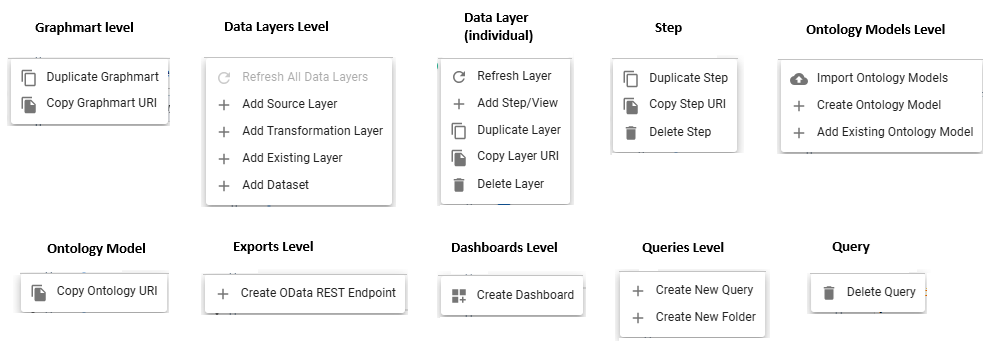
-
Expand the Exports item to view your Data on demand endpoints (OData REST endpoints),
-
Expand Dashboards to see references to any of the Hi-Res Analytics Dashboards that point to this graphmart, You can also create dashboards from this view.
-
Queries can be saved into the graphmart as a set of shared queries for that graphmart. Click the Queries item to see a filtered-down view of the query audit log for this graphmart (Graph Lakehouse connection).
-
Expand the Connections item to view the graphmart's source database connections and File Staging areas. The database connection view allows you to change the database connection settings and test the connection.
See Graphmart Overview.