HTML Reports#
Some examples require external input files. Before you start, please follow the link in the Example Scripts section to download the zip file with model and result files.
Example 01 - Creating a complete report in HTML#
First, preliminary steps are performed to collect the data for the report. In HyperMesh client a model and results are loaded and entities of HyperMesh post classes such as PlotcontrolContour and PlotcontrolTensor are created to capture the plots of interest with CaptureImageTool.
Then the report session and the document are initilized. Finally, chapters, text, tables and images are added based on collected data from the model.
In the end, the template is set and the HTML is exported to the ../Export directory and opened.
  1import hw
  2import os
  3import report.hwxdocxtypes as reporting
  4
  5
  6# Preleminaries for the demo (loading a file, results, creating some contours and tensor plot and capture them)
  7scriptdir = os.path.dirname(os.path.abspath(__file__))
  8hmFile = os.path.join(scriptdir, "aerobox", "aerobox.fem")
  9resFile = os.path.join(scriptdir, "aerobox", "aerobox-LC1-2.op2")
 10
 11import hm
 12import hm.entities as ent
 13
 14sess = hw.Session()
 15win1 = sess.get(tag=hw.Window, id=1, page=1)
 16win1.type='fepre'
 17
 18model = hm.Model()
 19if not win1.isEmpty():
 20    model.hm_answernext("yes")
 21    model.deletemodel()
 22
 23model.start_batch_import(mode=2)
 24model.feinputwithdata2(
 25    import_reader="#optistruct/optistruct",
 26    filename=hmFile,
 27    overwrite_flag=0,
 28    reserved1=0,
 29    cleanup_tolerance=0,
 30    blanked_component=0,
 31    offset_flag=0,
 32    string_array=[
 33        "OptiStruct ",
 34        " ",
 35        "CREATE_ONE_COMP_ACROSS_INCLUDES ",
 36        "ASSIGNPROP_BYHMCOMMENTS ",
 37        "CREATE_PART_HIERARCHY",
 38        "IMPORT_MATERIAL_METADATA",
 39        "ENGINEERINGENTITIES ",
 40        "ANSA ",
 41        "PATRAN ",
 42        "EXPAND_IDS_FOR_FORMULA_SETS ",
 43        "CONTACTSURF_DISPLAY_SKIP ",
 44        "LOADCOLS_DISPLAY_SKIP ",
 45        "SYSTCOLS_DISPLAY_SKIP ",
 46        "VECTORCOLS_DISPLAY_SKIP ",
 47    ],
 48    scale_factor=1.0,
 49    name_comps_by_layer=0,
 50)
 51model.end_batch_import()
 52loadcolSet = hm.CollectionSet(model)
 53loadcolSet.set(hm.Collection(model, ent.Loadcol))
 54model.hideentitybymark(collection_set=loadcolSet)
 55
 56res = ent.Result(model)
 57res.resultfiles = [f"{resFile}"]
 58res.init = 1
 59
 60model.rotateabout(overridedefault=1, x=756.703568, y=2926.22443, z=1708.34003)
 61model.viewset(
 62    0.992622267,
 63    0.0320712525,
 64    0.116929341,
 65    0,
 66    -0.0183647278,
 67    0.993024857,
 68    -0.116466176,
 69    0,
 70    -0.119848958,
 71    0.113459544,
 72    0.986287564,
 73    0,
 74    74.2850936,
 75    -2768.32299,
 76    1974.16452,
 77    1,
 78    -481.944534,
 79    -1388.37276,
 80    1615.79217,
 81    2099.54578,
 82)
 83model.window(0, 0, 0, 0, 0)
 84
 85plotc1 = ent.PlotcontrolContour(model, name="contour1", datatype="Stress", layer="Z1")
 86plotc1.plot = True
 87capture = hw.CaptureImageTool()
 88capture.type = "png"
 89capture.width = 1200
 90capture.height = 800
 91capture.file = os.path.join(scriptdir, "aerobox", "loadcase_1.png")
 92capture.capture()
 93
 94model.window(function=2, xmin=10, ymin=2, xmax=10, ymax=2)
 95plotten1 = ent.PlotcontrolTensor(model, name="tensor1", datatype="Stress", layer="Z1")
 96plotten1.plot = True
 97plotten1.txx = True
 98plotten1.tyy = True
 99plotten1.tzz = True
100plotten1.txy = True
101plotten1.tyz = True
102plotten1.tzx = True
103
104
105capture = hw.CaptureImageTool()
106capture.type = "png"
107capture.width = 1200
108capture.height = 800
109capture.file = os.path.join(scriptdir, "aerobox", "loadcase_1_tensor.png")
110capture.capture()
111
112
113model.window(0, 0, 0, 0, 0)
114plotten1.plot = False
115model.setsimulationstep(subcase_id=2, simulation_id=2)
116capture = hw.CaptureImageTool()
117capture.type = "png"
118capture.width = 1200
119capture.height = 800
120capture.file = os.path.join(scriptdir, "aerobox", "loadcase_2.png")
121capture.capture()
122
123
124# Creating a report session object if needed
125rep_ses = reporting.ReportSession()
126
127# Creating Documents in the current session
128doc1 = reporting.Document()
129
130# Creating 'Loadcase1' at 'Aerobox' chapter
131chap1 = reporting.Chapter(name="Aerobox", parent=doc1)
132chap11 = reporting.Chapter(name="Loadcase1", parent=chap1)
133
134
135loadc1_text = reporting.Text()
136loadc1_text.text = "This is the Von Mises Stresses for the 1st loadcase\n"
137
138# Create DocText and DocImage for chapter "Loadcase1"
139doctext1 = reporting.DocText(text=loadc1_text, parent=chap11, name="DocText11_name")
140docimage1 = reporting.DocImage(
141    image=os.path.join(scriptdir, "aerobox", "loadcase_1.png"),
142    parent=chap11,
143    name="DocImage_11_Name",
144)
145docimage1.caption = "Results_1"  # DocImage caption
146doctext1.underline = True  # Underline
147doctext1.boldFont = True  # Bold
148doctext1.italicFont = True  # Italics
149doctext1.lineBreak = True  # Break after line
150doctext1.fontColor = [255, 0, 0]  # red color in text
151doctext1.fontSize = 15  # Change font size
152doctext1.fontName = "Calibri"  # Change font
153
154
155# Create DocText for "Loadcase1" and add nested text and image
156doctext2 = reporting.DocText(
157    text="The Von Mises stresses as tensor\n",
158    parent=chap11,
159    name="DocText11_extra_name",
160)
161doctext2.addFormatedText(text="Look at the figure below:", line_break=True)
162doctext2.addImage(
163    image=os.path.join(scriptdir, "aerobox", "loadcase_1_tensor.png"),
164    lineBreak=True,
165)
166doctext2.alignment = "center"  # Align text
167
168
169# Creating 'Loadcase2' at 'Aerobox' chapter
170chap12 = reporting.Chapter(name="Loadcase2", parent=chap1)
171loadc2_text = reporting.Text()
172loadc2_text.text = "This is the Von Mises Stresses for the 2nd loadcase\n"
173doctext3 = reporting.DocText(text=loadc2_text.text, parent=chap12, name="DocText12_name")
174docimage3 = reporting.DocImage(
175    image=os.path.join(scriptdir, "aerobox", "loadcase_2.png"),
176    parent=chap12,
177    name="DocImage_12_Name",
178)
179docimage3.caption = "Results_2"
180
181# Creating 'Table_chapter' chapter and insert a DocTable
182chap2 = reporting.Chapter(name="Table_chapter", parent=doc1)
183doctable = reporting.DocTable(
184    table=os.path.join(
185        rf"{hm.altair_home}\demos\report\data", "model_statistics.csv"
186    ),
187    parent=chap2,
188    name="DocTable_name",
189)
190doctable.caption = "Table with Data"
191
192# Paste all DocImages of 'Aerobox' to 'Table_chapter'
193rep_ses.paste(chap1.getChildren(type=[reporting.DocImage], childrenLevel="all"), chap2)
194
195# Set a template and export
196doc1.templateHMTL = rf"{hm.altair_home}/hwx/scripts/python/report/io/html/templates/defaultdocumenttemplate/template.html"
197errObj, filepath = doc1.saveAsHTML(
198    os.path.join(scriptdir, "..", "Export", f"{doc1.name}.html"),
199    open=True,
200)
201
202if errObj.status==0:
203    print("HTML Exported in", filepath)
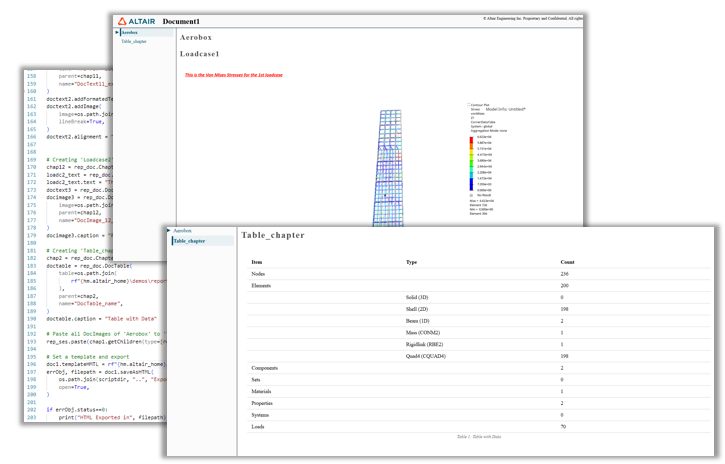
Figure 1. Output of Example 06 from DOCX section, as HTML
Example 02 - Creating a HTML report with tables#
In this example, a table is created and various options are set to demonstrate the capabilities of table objects. These options are:
Adding a filter of type combobox for the table headers.
Autosorting option when clicking on the table headers.
Values displayed in a tooltip when hovering above the cells.
Row and column coloring.
Exporting at 50% of the width defined by the template placeholder.
The table is inserted in a chapter and the HTML is exported.
 1import hm
 2import report.hwxdocxtypes as reporting
 3
 4# Creating a report session object if needed
 5rep_ses = reporting.ReportSession()
 6
 7# Creating Documents in the current session
 8doc1 = reporting.Document()
 9
10# Creating 'Table_chapter' chapter and insert a DocTable after modifying accordingly a Table object
11tab = reporting.Table()
12tab.csvFile = os.path.join(
13    rf"{hm.altair_home}\demos\report\data", "model_statistics.csv"
14)
15tab.caption = "Table with Data"
16tab.captionposition = "top"
17
18# HTML modification
19tab.filterTypeHTML = "combo"
20tab.autoToolTipHTML = True
21tab.setColumnColor(index=2, color=[255, 0, 0])  # Set column color (contour values)
22tab.setRowColor(
23    index=9, color=[0, 255, 0]
24)  # Set row color (entity) (the row index starts from 1)
25tab.autoSortHTML = True
26tab.stretch = False
27
28chap = reporting.Chapter(name="Table_chapter", parent=doc1)
29doctable = reporting.DocTable(
30    table=tab,
31    parent=chap,
32    name="DocTable_name",
33)
34doctable.width = 50  # 50% of the initial width respective to the template
35
36# Set a template and export
37doc1.templateHMTL = rf"{hm.altair_home}/hwx/scripts/python/report/io/html/templates/defaultdocumenttemplate/template.html"
38errObj, filepath = doc1.saveAsHTML(
39    f"{doc1.name}.html",
40    open=True,
41)
42
43if errObj.status == 0:
44    print("HTML Exported in", filepath)
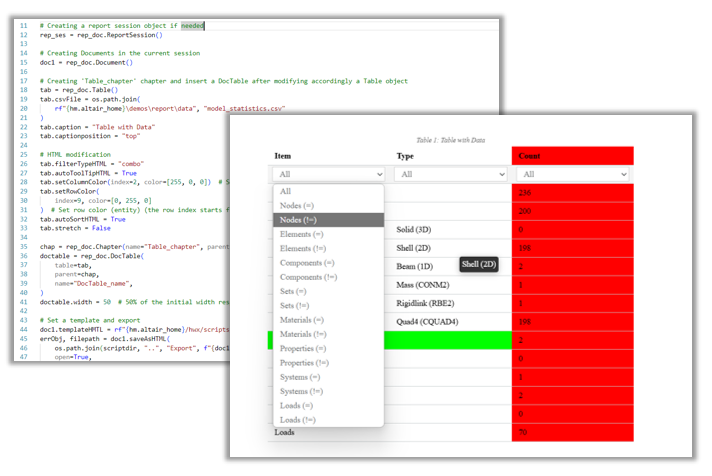
Figure 2. Filtering, sorting, adding tooltip, coloring and modifying width in tables in HTML
Example 03 - Creating a complete presentation-based report in HTML#
After loading a model with results in HyperView client and applying a contour plot, the report session and presentation are initialized.
First, a slide and a text object are created. Three Paragraph objects are inserted into the text object as a bullet-type list. Subsequently, a SlideText object is defined combining the slide and the text object.
Secondly, a PNG image is captured from the graphics and cropped. The image is then added to the first slide - this is possible due to the slide’s 2-window layout defined via the CSSStyle template.
Next, another slide is created containing a table with header filter as a text bar. Images slides 3 and 4 and added afterwards. Finally, the presentation is exported.
  1import hw.hv as hv
  2import hw
  3import hm
  4import os
  5import report.hwxpptxtypes as reporting
  6
  7
  8# Preleminaries for the demo (loading a file, results, creating some contours)
  9
 10ALTAIR_HOME = os.path.abspath(os.environ["ALTAIR_HOME"])
 11modelFile = os.path.join(
 12    ALTAIR_HOME, "demos", "mv_hv_hg", "animation", "dyna", "bumper", "bumper_deck.key"
 13)
 14resultFile = os.path.join(
 15    ALTAIR_HOME, "demos", "mv_hv_hg", "animation", "dyna", "bumper", "d3plot"
 16)
 17
 18ses = hw.Session()
 19ses.new()
 20win = ses.get(hw.Window)
 21# Set Window to Animation
 22win.type = "animation"
 23# Add Model
 24win.addModelAndResult(modelFile, result=resultFile)
 25# Set scalar, vector and tensor results
 26res = ses.get(hv.Result)
 27resScalar = hv.ResultDefinitionScalar(dataType="Displacement", dataComponent="Mag")
 28res.plot(resScalar)
 29# Set View
 30hw.evalHWC(
 31    "view projection orthographic | view matrix -0.021537 0.988942 0.146732 0.000000 0.872753 0.090190 -0.479758 0.000000 -0.487686 0.117728 -0.865045 0.000000 -99.918198 345.190369 584.070618 1.000000 | view clippingregion -284.806213 129.713852 528.670959 864.158752 -722.333801 601.748169"
 32)
 33# Set time step
 34animTool = hw.AnimationTool()
 35animTool.currentFrame = res.getSimulationIds()[-2]
 36
 37
 38# Creating a report session object if needed
 39rep_ses = reporting.ReportSession()
 40
 41# Creating Presentations in the current session
 42pres1 = reporting.Presentation()
 43
 44# Creating 'Loadcase1' at 'Aerobox' slide
 45slide1 = reporting.Slide(name="Aerobox", presentation=pres1)
 46
 47dispc1_text = reporting.Text()
 48dispc1_text.text = "This is the Displacement for the 1st loadcase\n"
 49
 50dispc1_text_pg = dispc1_text.getParagraph()
 51dispc1_text_run0 = dispc1_text_pg.getRun()
 52dispc1_text_run0.underline = True  # Underline
 53dispc1_text_run0.italicFont = True  # Bold
 54dispc1_text_run0.lineBreak = True  # Break after line
 55dispc1_text_run0.fontColor = [255, 0, 0]  # red color in text
 56dispc1_text_run0.fontSize = 15  # Change font size
 57dispc1_text_run0.fontName = "Calibri"  # Change font
 58dispc1_text_pg.bulletType = reporting.MsBulletType.BulletUnnumbered
 59dispc1_text_pg.bulletStyle = reporting.PpBulletCharStyle.filledRoundCircle
 60
 61# Adding another text using paragraph
 62dispc1_text_pg2 = reporting.Paragraph(
 63    parent=dispc1_text
 64)  # Alt: dispc1_text.addParagraph()
 65dispc1_text_run1 = dispc1_text_pg2.getRun()
 66dispc1_text_run1.runText = "Left the images are following"
 67dispc1_text_run1.fontSize = 12
 68dispc1_text_pg2.bulletType = reporting.MsBulletType.BulletUnnumbered
 69dispc1_text_pg2.bulletStyle = reporting.PpBulletCharStyle.filledRoundCircle
 70
 71dispc1_text_pg2 = reporting.Paragraph(
 72    parent=dispc1_text
 73)  # Alt: dispc1_text.addParagraph()
 74dispc1_text_run1 = dispc1_text_pg2.getRun()
 75dispc1_text_run1.runText = "Left the image of displacemt is following"
 76dispc1_text_run1.fontSize = 12
 77dispc1_text_pg2.bulletType = reporting.MsBulletType.BulletUnnumbered
 78dispc1_text_pg2.bulletStyle = reporting.PpBulletCharStyle.filledRoundCircle
 79
 80dispc1_text_pg3 = reporting.Paragraph(
 81    parent=dispc1_text
 82)  # Alt: dispc1_text.addParagraph()
 83dispc1_text_run2 = dispc1_text_pg3.getRun()
 84dispc1_text_run2.runText = "The main variable in FEM are the displacements"
 85dispc1_text_run2.fontSize = 12
 86dispc1_text_pg2.alignment = reporting.PARAGRAPH_ALIGN.CENTER
 87dispc1_text_pg2.bulletType = reporting.MsBulletType.BulletNumbered
 88dispc1_text_pg2.bulletStyle = reporting.PpBulletNumberedStyle.arabicDbPeriod
 89
 90slide1.cssclassidHTML = "layout-2"
 91
 92
 93# Create SlideText for slide1
 94slidetext1 = reporting.SlideText(text=dispc1_text, slide=slide1, name="sltxt1_name")
 95
 96# Take the captured image
 97i1 = reporting.Image()
 98i1.source = "graphic"
 99i1.page = 1
100i1.window = 1
101i1.caption = "General caption for image 1"
102i1.alignment = "right"
103i1.format = "png"
104i1.crop = 1
105slim = reporting.SlideImage(image=i1, slide=slide1, name="slim1_name")
106
107
108# Creating 'Table_slideter' slide and insert a DocTable after modifying accordingly a Table object
109tab = reporting.Table()
110tab.csvFile = os.path.join(
111    rf"{hm.altair_home}\demos\report\data", "model_statistics.csv"
112)
113tab.caption = "Table with Data"
114tab.captionposition = "top"
115
116# HTML modification
117tab.filterTypeHTML = "text"
118tab.autoToolTipHTML = True
119tab.setColumnColor(index=2, color=[255, 0, 0])  # Set column color (contour values)
120tab.setRowColor(
121    index=9, color=[0, 255, 0]
122)  # Set row color (entity) (the row index starts from 1)
123tab.autoSortHTML = True
124tab.stretch = False
125
126slide2 = reporting.Slide(name="Table_slide", parent=pres1)
127slide2.add(tab, "tab1")
128
129# GLB export
130slide3 = reporting.Slide(name="Glb_slide", parent=pres1)
131
132# Create image from graphics
133i2 = reporting.Image()
134i2.source = "graphic"
135i2.page = 1
136i2.window = 1
137i2.caption = "General caption for image 1"
138i2.alignment = "right"
139i2.format = "glb"
140
141slide3.add(i2, "im2")
142
143# H3D export
144slide4 = reporting.Slide(name="H3D_slide", parent=pres1)
145
146# Create image from graphics
147i3 = reporting.Image()
148i3.source = "graphic"
149i3.page = 1
150i3.window = 1
151i3.caption = "General caption for image 1"
152i3.alignment = "right"
153i3.format = "h3d"
154slide4.add(i3, "im3")
155
156# Forcing a recapture from the graphics in case of run
157pres1.update()
158
159# Export
160errObj, filepath = pres1.saveAsHTML(
161    f"{pres1.name}.html",
162    open=True,
163)
164
165if errObj.status == 0:
166    print("HTML Exported in", filepath)
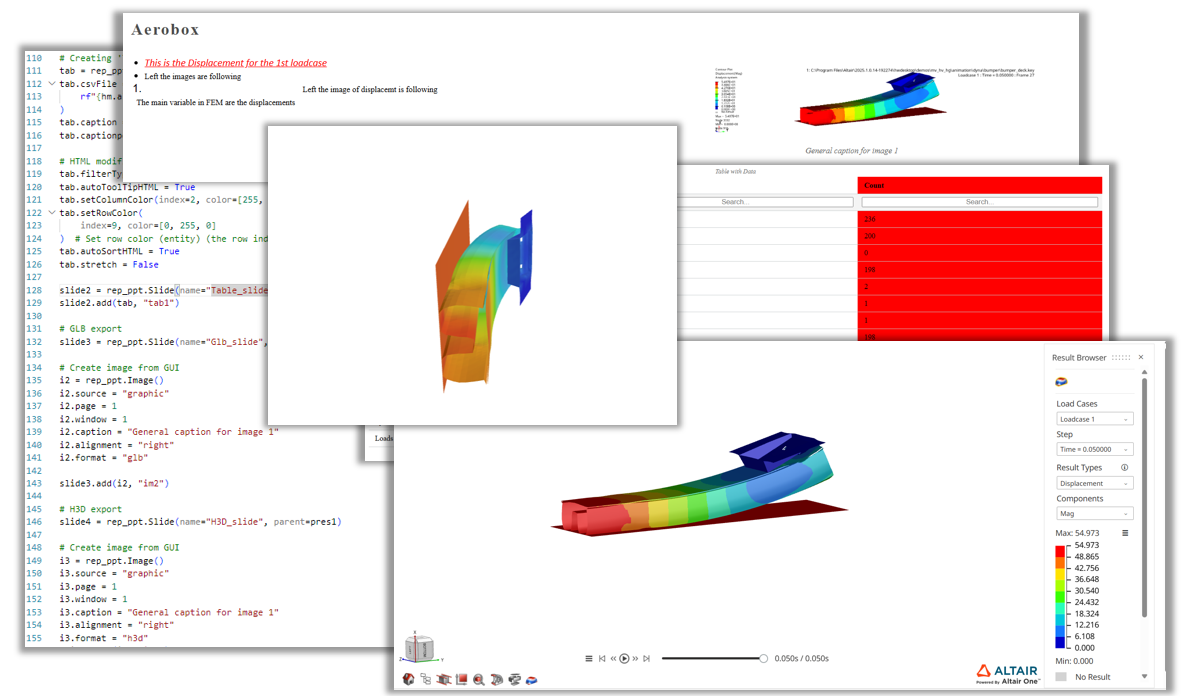
Figure 3. Complete ppt-based report