PowerPoint Reports#
Some examples require external input files. Before you start, please follow the link in the Example Scripts section to download the zip file with model and result files.
Example 01 - Creating a PPTX report with a single screenshot#
After initializing the report session and presentation, a slide is defined.
Two image objects are created. The first one is generated by using the CaptureImageTool. The second one is created via the reporting APIs. Specifically, by setting the second image source to "graphic", the image is captured from the grpahics directly in the specified resolution.
The update() method is used to capture all the images from the graphics. The crop attribute can be used to crop the images.
Finally, the images are added to the slide and the presentation is exported.
 1import hw
 2import hm
 3import os
 4
 5import report.hwxpptxtypes as reporting
 6
 7# Initializing report session
 8rep_ses = reporting.ReportSession()
 9
10# Creating report, setting resolution and template
11pres = reporting.Presentation()
12pres.resolution = "HD"
13pres.template = f"{hm.altair_home}/hwx/scripts/python/report/io/presentation/templates/pptTemplate.pptx"
14
15# Capturing using capture tool
16capture = hw.CaptureImageTool()
17capture.type = "jpg"
18capture.width = 1920
19capture.height = 1080
20
21imgList = list()
22imgPath = f'{hw.appinfo("CURRENTWORKINGDIR")}/image01.jpg'
23imgList.append(imgPath)
24capture.file = imgPath
25capture.capture()
26
27slide = reporting.Slide(
28    "Report Demo | Images",
29    presentation=pres,
30)
31slide.layout("Two Images with Captions")
32
33# Defining two image one using a file and other from graphics
34
35image1 = reporting.Image()
36image1.path = imgPath
37image1.caption = "Image from CaptureImageTool"
38
39image2 = reporting.Image()
40image2.source = "graphic" # By default it captures from page=1, window=1
41image2.crop = True # The exported image is cropped.
42image2.caption = "Image catpured using Report APIs"
43
44slide.add(image1, "pic1")
45slide.add(image2, "pic2")
46
47# Forcing the capture of all images in the current presentation in which,
48# the source is "graphic".
49pres.update()
50
51errObj, filepath = pres.savePPTX(
52    f'{hw.appinfo("CURRENTWORKINGDIR")}/report_test.pptx',
53    open=True,
54    mode="write",
55    newname="true",
56)
57
58# If status=0 then presention successfully published
59if errObj.status == 0:
60    print("Presentation is published at", filepath)
61
62for img in imgList:
63    os.remove(img)
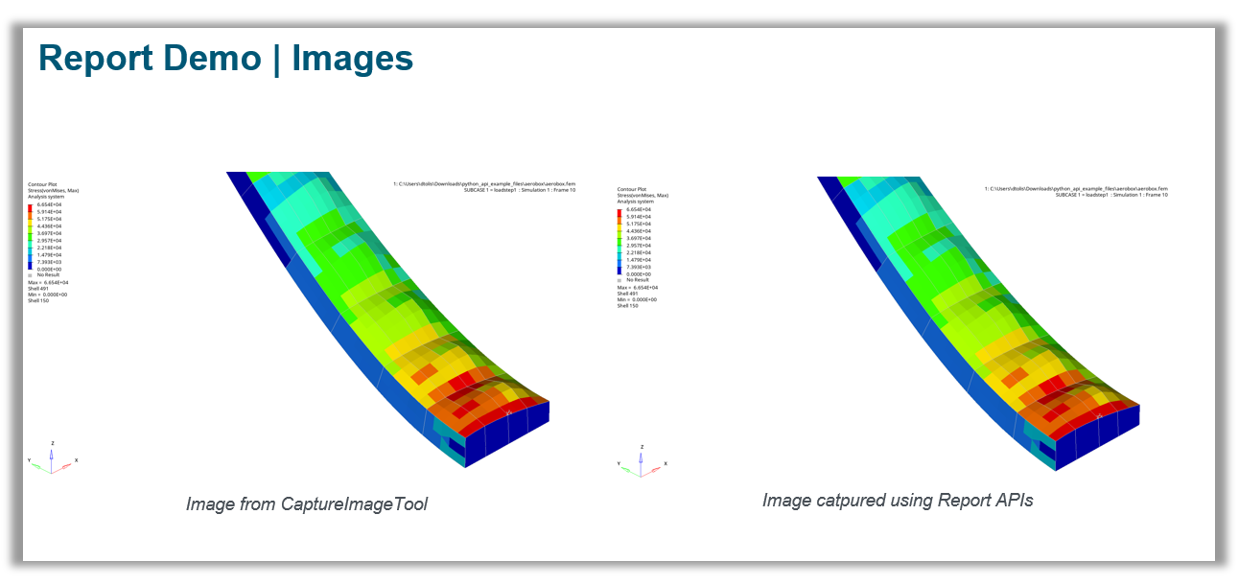
Figure 1. Slide with Images captured directly from graphics area
Example 02 - Creating a PPTX report with a table/equation/image#
After initializing the report session and presentation, a slide is created and its layour is defined.
A table, a text, and an image object are defined. The table content is generated from a CSV file and the image is defined via a byte stream from a file.
After all objects are added to the slide, the presentation is exported.
 1import hw
 2import hm
 3import os
 4import numpy as np
 5
 6import report.hwxpptxtypes as reporting
 7
 8session = hw.Session()
 9datadir = rf"{hm.altair_home}\demos\report\data"
10
11# Initializing report session
12rep_ses = reporting.ReportSession()
13
14# Defining presentation and setting the template
15pres = reporting.Presentation()
16pres.template = f"{hm.altair_home}/hwx/scripts/python/report/io/presentation/templates/pptTemplate.pptx"
17
18# Defining slide and slide layout
19slide1 = reporting.Slide(
20    "Report Demo | Table | Equation | Binary Image",
21    presentation=pres,
22)
23slide1.layout("One Table with Text and Image")
24
25# Create a Table, remove row 8 and column 2
26tab1 = reporting.Table("Table1")
27tab1.csvFile = os.path.join(datadir, "model_mass.csv")
28tab1.caption = "Entire Model Mass Statistics Summary."
29tab1.removeRow(8)
30tab1.removeColumn(2)
31# Merge two cells
32cell1 = tab1.cell(0, 0)
33cell2 = tab1.cell(1, 1)
34tab1.mergeCells(cell1, cell2)
35
36
37# Create a text with equations
38text1 = reporting.Text()
39text1.text = r"expr($\frac{d(x^5)}{dx} = 5 x^4$)"
40
41# Create an image from binary stream
42img_bin_path = os.path.join(datadir, "element_coordinate_system.png")
43with open(img_bin_path, "rb") as f:
44    img_bin = f.read()
45img1 = reporting.Image()
46img1.binarydata = np.frombuffer(img_bin, dtype=np.ubyte)
47
48# Add content to slide
49slide1.add(text1, "Text_1")
50slide1.add(tab1, "Table_1")
51slide1.add(img1, "Image_1")
52
53# Export in the working directory with default name
54errObj, filepath = pres.savePPTX(open=True)
55
56# If status=0 then presention successfully published
57if errObj.status == 0:
58    print("Presentation is published at", filepath)
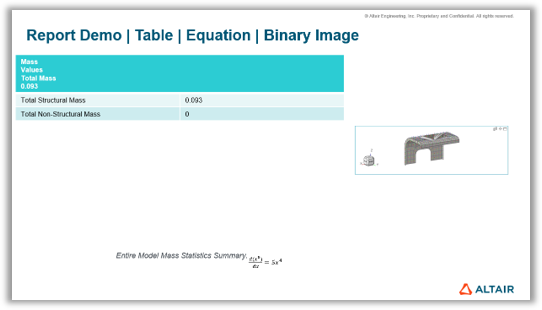
Figure 2. Slide with Table, Equation (Text) and Image
Example 03 - Creating a PPTX report with a video captured from the graphics#
After initializing the report session and presentation, two slides are defined.
For the video definition, an image object is used with source="graphic" and format="mp4".
After the video is added to the first slide, a paragraph is defined using a text object and added to the second slide.
Finally, the presentation is exported.
Note
The example requires a model and results to be loaded in the HyperView client prior to executing the code.
 1import hw
 2import hm
 3
 4import report.hwxpptxtypes as reporting
 5
 6session = hw.Session()
 7datadir = rf"{hm.altair_home}\demos\report\data"
 8
 9# Initializing report session
10rep_ses = reporting.ReportSession()
11
12# Defining presentation and setting the template
13pres = reporting.Presentation()
14pres.template = f"{hm.altair_home}/hwx/scripts/python/report/io/presentation/templates/pptTemplate.pptx"
15
16# Defining slide
17slide1 = reporting.Slide(
18    "Report Demo | Video",
19    presentation=pres,
20)
21
22# Create an mp4 video captured from graphics
23img1 = reporting.Image()
24img1.source = "graphic"
25img1.format = "mp4"
26
27slide1.add(img1, "Image_1")
28
29# Defining slide
30slide2 = reporting.Slide(
31    "Report Demo | Paragraph",
32    presentation=pres,
33)
34
35# Create a text with equations
36text1 = reporting.Text()
37text1.text = "Content_1"
38
39pg_1 = text1.getParagraph()
40text_run1 = pg_1.getRun()
41text_run1.underline = True # Underline
42text_run1.italicFont = True # Bold
43text_run1.lineBreak = True # Break after line
44text_run1.fontColor = [255, 0, 0] # red color in text
45text_run1.fontSize = 15 # Change font size
46text_run1.fontName = "Calibri" # Change font
47pg_1.bulletType =  reporting.MsBulletType.BulletUnnumbered
48pg_1.bulletStyle=reporting.PpBulletCharStyle.filledRoundCircle
49
50# Adding another text using paragraph
51pg_2 = reporting.Paragraph(parent=text1) # Alt: text1.addParagraph()
52text_run2 = pg_2.getRun()
53text_run2.runText = "Content_2"
54text_run2.fontSize = 12
55pg_2.bulletType =  reporting.MsBulletType.BulletUnnumbered
56pg_2.bulletStyle = reporting.PpBulletCharStyle.filledRoundCircle
57
58# Add content to slide
59slide2.add(text1, "Text_1")
60
61# Forcing the capture of all images in the current presentation in which,
62# the source is "graphic".
63pres.update()
64
65# Export in the working directory with default name
66errObj, filepath = pres.savePPTX(open=True)
67
68# If status=0 then presention successfully published
69if errObj.status == 0:
70    print("Presentation is published at", filepath)
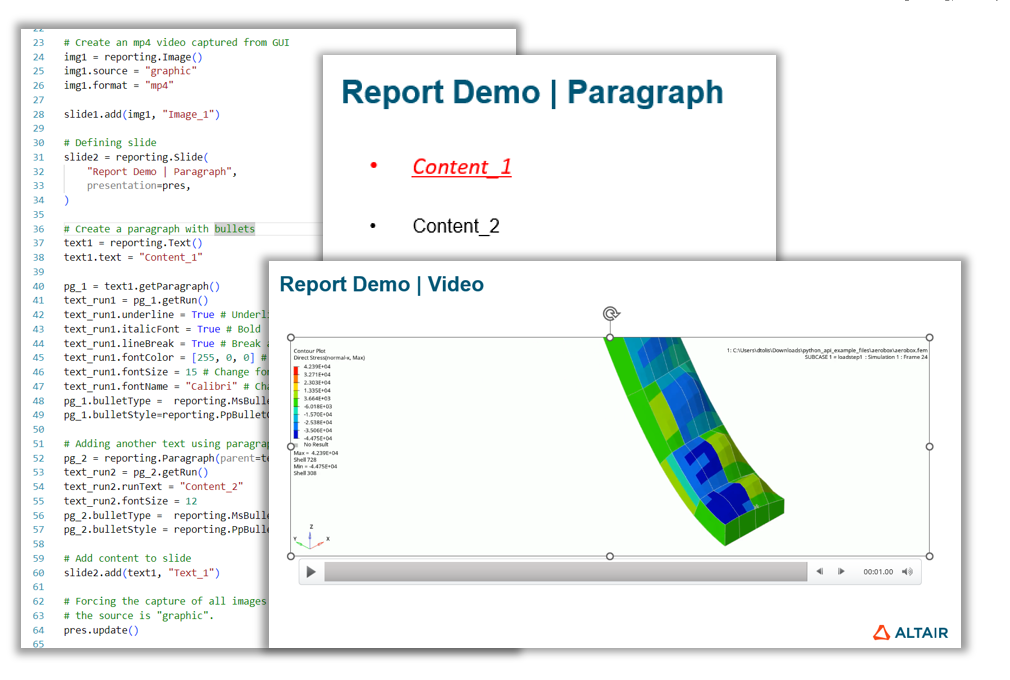
Figure 2. Slides with Video and paragraph