Run
Analyze the model and generate the results.
-
From the Analyse ribbon, Analysis tool group, click the Run
Solver tool, which runs the SEAM
code to analyze the model after it is generated.
Figure 1. 
-
From the guide bar, click
 to select additional options.
Figure 2. 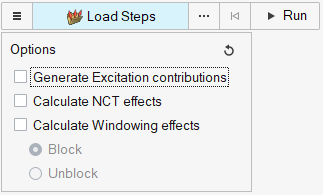
-
Click
 to display the Advanced Selection dialog. Select
the required load steps.
to display the Advanced Selection dialog. Select
the required load steps.
-
You can select a single load step or multiple load steps simultaneously. Select
the necessary options and click Run.
- Generate excitation contributions
- Calculate excitation contributions.
- Calculate NCT effects
- Calculate NCT effects.
- Calculate Windowing effects
- Select the Block or
Unblock option for calculating the
windowing technique to be calculated.Note: This option is on by default.
- SEAM displays its progress. The display may close after the run is completed.
-
For the Windowing option, select the groups using the Regions options, which
need to be considered for windowing effects.
Note: The groups should have only SEA subsystems.
-
From the Analyse ribbon, Analysis tool group, click the
Contour tool to define the contour.
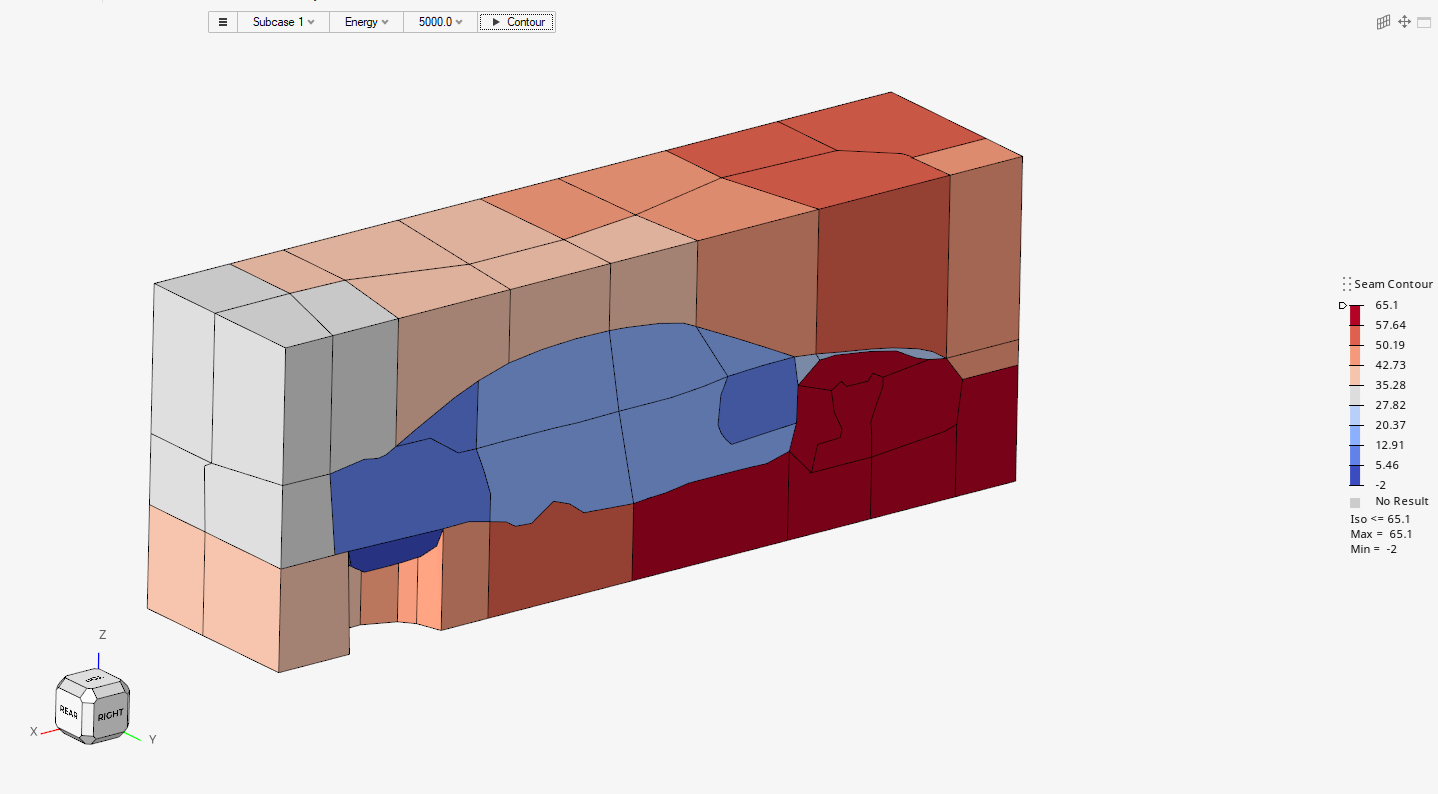
Figure 3. 
- From the guide bar, select the type of contour to create by selecting Load Steps, Energy, and Frequency of Interest.
- From the guide bar, click = to select inplane or bending for plotting structural response.
- Click Contour.
-
Right-click on Subsystems Displayed to perform
visualization selections.
Figure 4. SEA Subsystem Contour