Annotations#
Some examples require external input files. Before you start, please follow the link in the Example Scripts section to download the zip file with model and result files.
Example 01 - Notes attached to Entities#
Create Notes attached to Entities#
 1import hw
 2import hw.hv as hv
 3import os
 4
 5scriptDir = os.path.abspath(os.path.dirname(__file__))
 6modelFile = os.path.join(scriptDir, "aerobox", "aerobox.fem")
 7resultFile = os.path.join(scriptDir, "aerobox", "aerobox-LC1-2.op2")
 8
 9ses = hw.Session()
10ses.new()
11win = ses.get(hw.Window)
12win.type = "animation"
13
14win.addModelAndResult(modelFile, result=resultFile)
15res = ses.get(hv.Result)
16resScalar = hv.ResultDefinitionScalar(
17    dataType="Composite Stress",
18    dataComponent="vonMises",
19    layer="Max"
20)
21res.plot(resScalar)
22animTool = hw.AnimationTool()
23animTool.currentFrame = 1
24hw.evalHWC("view orientation iso")
25
26noteDict = {
27    "elements": [493, 353, 674, 733],
28    "fontSizes": [16, 12, 12, 12],
29    "colors": ["#FF0000", "#FFFFFF", "#FFFFFF", "#FFFFFF"],
30}
31
32for elem, fsize, col in zip(
33    noteDict.get("elements"), noteDict.get("fontSizes"), noteDict.get("colors")
34):
35    n = hv.Note(
36        label="Element " + str(elem),
37        attachmentType="element",
38        attachment=[1, "element", elem],
39        text="Element: {entity.id}\nValue = {entity.contour_val}",
40        textColorMode="user",
41        textColor=col,
42        borderColorMode="user",
43        borderColor=(20, 20, 20),
44        fillColor=(31, 73, 125),
45        fontSize=fsize,
46        transparency=False,
47        moveToEntity=True,
48        screenAnchor=False,
49    )
50
51fieldDic = n.getFieldDictionary()
52for key in list(fieldDic.keys()):
53    print("{:35s} {:3s} {:50s}".format(key, " = ", fieldDic[key]))
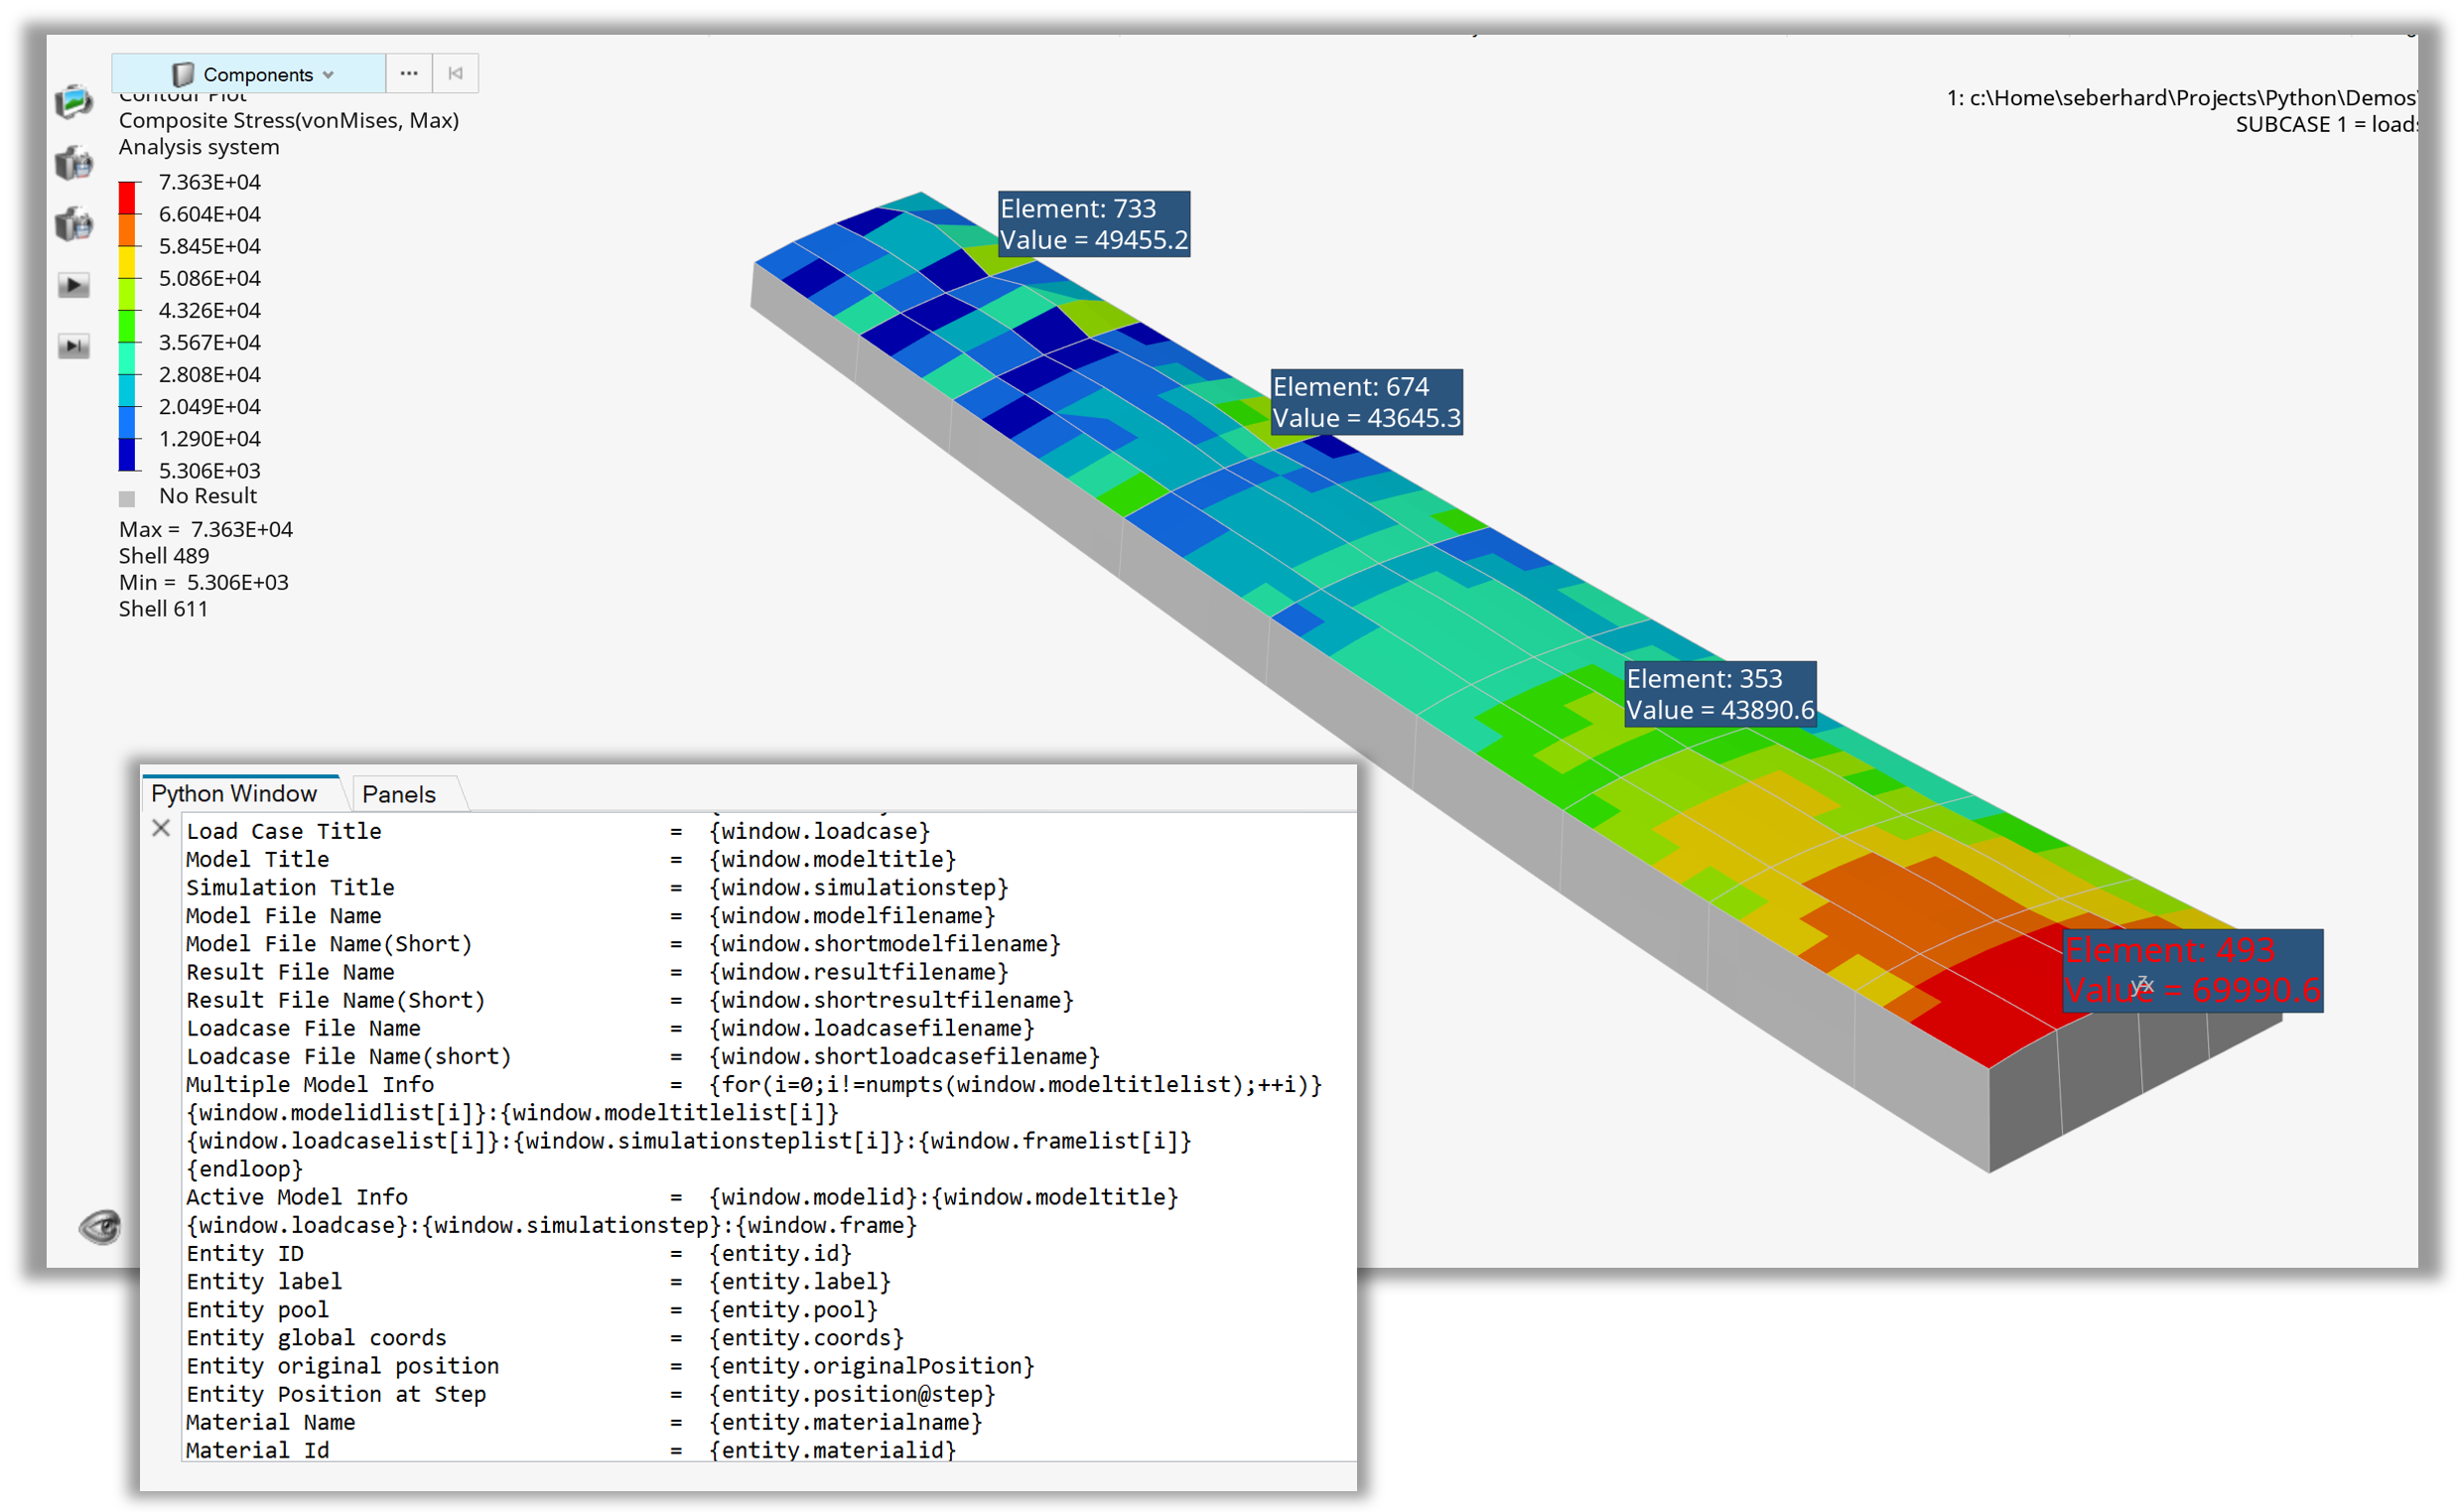
Figure 1. Notes attached to entities with getFieldDictionary() output
Example 02 - Measure Position#
Measure Positon with Rectangular System#
 1import hw
 2import hw.hv as hv
 3import os
 4
 5ALTAIR_HOME = os.path.abspath(os.environ['ALTAIR_HOME'])
 6modelFile   = os.path.join(ALTAIR_HOME,'demos','mv_hv_hg','animation','dyna','bumper','bumper_deck.key')
 7resultFile  = os.path.join(ALTAIR_HOME,'demos','mv_hv_hg','animation','dyna','bumper','d3plot')
 8
 9ses = hw.Session()
10ses.new()
11win=ses.get(hw.Window)
12win.type = 'animation'
13
14win.addModelAndResult(modelFile, result=resultFile)
15res = ses.get(hv.Result)
16resScalar = hv.ResultDefinitionScalar(dataType='Displacement',
17                dataComponent='Mag')
18res.plot(resScalar)
19animTool = hw.AnimationTool()
20animTool.currentFrame=26
21
22hw.evalHWC('view projection orthographic | \
23         view matrix  0.174593   0.948911    0.262841 \
24                 0.000000  -0.964156    0.218925 \
25                -0.149918   0.000000   -0.199801 \
26                -0.227245   0.953121    0.000000 \
27                 351.268646 512.829834 -658.386963 1.000000 | \
28         view clippingregion -251.830444  96.738075  555.359558 \
29                837.470154 -722.333801 601.748169')
30
31model  = ses.get(hv.Model)
32n1 = model.get(hv.Node,207)
33n2 = model.get(hv.Node,11)
34n3 = model.get(hv.Node,44)
35
36sysRect = hv.System(type='rectangular',fixed=False)
37sysRect.label = 'Rectangular System'
38sysRect.labelVisibility = True
39sysRect.setOrientationByNode(origin     = n1,
40             axis       = n2,
41             plane      = n3,
42             axisplane  = 'X-XY')
43
44nodeIdList = [1075,999,1568,1266]
45
46measurePosition = hv.MeasurePosition()
47
48nodeObjectList = []
49for nodeId in nodeIdList:
50    nodeObjectList.append(model.get(hv.Node,nodeId))
51
52measurePosition.addEntities(nodeObjectList)
53measurePosition.label               = 'Position'
54measurePosition.displayLabel        = True
55measurePosition.displayId           = True
56measurePosition.color               = (0,0,0)
57measurePosition.fontSize            = 12
58measurePosition.numericFormat       = 'scientific'
59measurePosition.numericPrecision    = 3
60measurePosition.transparency        = False
61measurePosition.autohide            = True
62measurePosition.prefix              = True
63
64win.draw()
65print(measurePosition.getMeasureProperties())
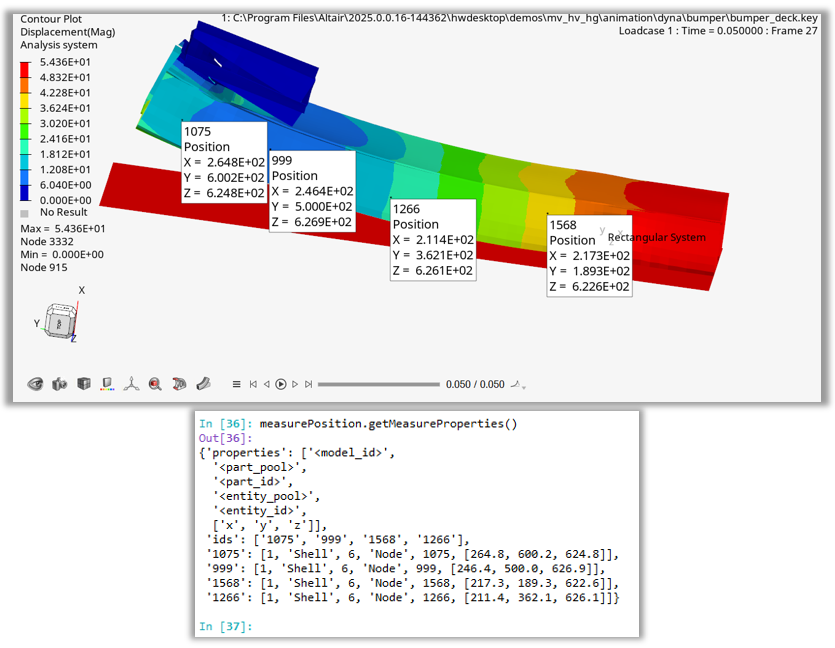
Figure 2. Position measures using node id list and print measure properties
Example 03 - Measure Minimum Distance#
Measure minimum distance between two collections of type part and node#
 1import hw
 2import hw.hv as hv
 3import os
 4
 5ALTAIR_HOME = os.path.abspath(os.environ['ALTAIR_HOME'])
 6modelFile   = os.path.join(ALTAIR_HOME,'demos','mv_hv_hg','animation','dyna','bumper','bumper_deck.key')
 7resultFile  = os.path.join(ALTAIR_HOME,'demos','mv_hv_hg','animation','dyna','bumper','d3plot')
 8
 9ses = hw.Session()
10ses.new()
11win=ses.get(hw.Window)
12win.type = 'animation'
13
14win.addModelAndResult(modelFile, result=resultFile)
15res = ses.get(hv.Result)
16resScalar = hv.ResultDefinitionScalar(dataType='Displacement',
17                dataComponent='Mag')
18res.plot(resScalar)
19animTool = hw.AnimationTool()
20animTool.currentFrame=26
21
22
23hw.evalHWC('view projection orthographic | \
24         view matrix  0.429744 0.751905 0.499958 \
25                 0.000000 -0.469094 0.659022 \
26                -0.587913 0.000000 -0.771538 \
27                 0.018125 0.635925 0.000000 \
28                 460.527435 157.489700 -354.629974 1.000000 | \
29          view clippingregion -251.830444 96.738075 555.359558 \
30                837.470154 -722.333801 601.748169')
31
32model  = ses.get(hv.Model)
33n1 = model.get(hv.Node,207)
34n2 = model.get(hv.Node,11)
35n3 = model.get(hv.Node,44)
36
37sysRect = hv.System(type='rectangular',fixed=False)
38sysRect.label = 'Rectangular System'
39sysRect.labelVisibility = True
40sysRect.setOrientationByNode(origin = n1,
41             axis       = n2,
42             plane      = n3,
43             axisplane  = 'X-XY')
44
45col1 = hv.Collection(hv.Node,populate=False)
46col1.addByID(hv.Part,3)
47
48col2 = hv.Collection(hv.Part,populate=False)
49col2.addByComponentName(['Mounting Bracket'])
50
51col3 = hv.Collection(hv.Part,populate=False)
52col3.addByID(hv.Node,col1.getIds())
53colHide = col2 + col3
54[p.setAttributes(meshMode='shadedMeshLines') for p in  colHide.getEntities()]
55colHide.reverse()
56model.hide(colHide)
57measureDistanceMinimum = hv.MeasureDistanceMinimum()
58measureDistanceMinimum.addEntities(col1,col2)
59
60measureDistanceMinimum.label               = 'Minimum Distance'
61measureDistanceMinimum.displayLabel        = True
62measureDistanceMinimum.displayId           = True
63measureDistanceMinimum.color               = '#000000'
64measureDistanceMinimum.fontSize            = 12
65measureDistanceMinimum.numericFormat       = 'fixed'
66measureDistanceMinimum.numericPrecision    = 3
67measureDistanceMinimum.transparency        = False
68measureDistanceMinimum.autohide            = False
69measureDistanceMinimum.prefix              = True
70
71win.draw()
72print(measureDistanceMinimum.getMeasureProperties())
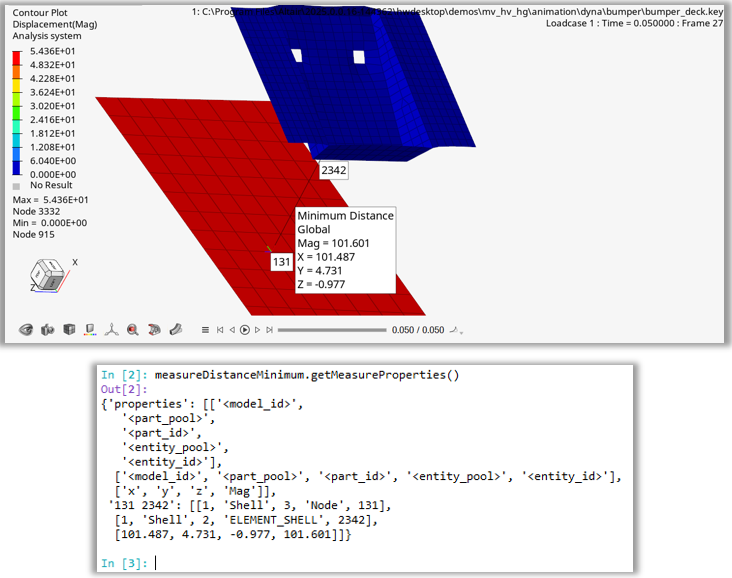
Figure 3. Minimum distance measure between between node and part collections