PowerPoint Reports#
Some examples require external input files. Before you start, please follow the link in the Example Scripts section to download the zip file with model and result files.
Example 01 - Creating a PPTX report with a single screenshot#
Code to create a PPTX report#
 1import hw
 2import hm
 3import os
 4
 5import report.hwxpptxtypes as reporting
 6
 7rep_ses = reporting.ReportSession(name="Report Demo")
 8pres = reporting.Presentation()
 9pres.resolution = "HD"
10pres.template = os.path.join(
11    hm.altair_home, "mv/scripts/tcl/report/templates/pptTemplate.pptx"
12)
13
14capture = hw.CaptureImageTool()
15capture.type = "jpg"
16capture.width = 1920
17capture.height = 1080
18
19imgList = list()
20imgPath = "C:/Temp/image01.jpg"
21imgList.append(imgPath)
22capture.file = imgPath
23capture.capture()
24
25slide = reporting.Slide(
26    "Report Demo | Images",
27    presentation=pres,
28)
29slide.layout("One Image with Caption")
30
31image = reporting.Image()
32image.path = imgPath
33slide.add(image, "pic1")
34
35pres.savePPTX(
36    "C:/Temp/report_test.pptx",
37    open=True,
38    mode="write",
39)
40
41for img in imgList:
42    os.remove(img)
43
44rep_ses.reset()
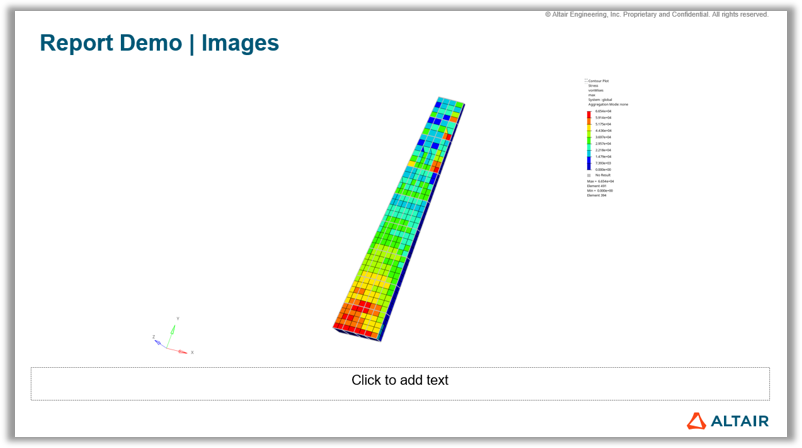
Figure 1. Slide with Image captured directly from graphics area
Example 02 - Creating a PPTX report with a table, equation, image#
Code to create a pptx with table and equation#
 1import hw
 2import hm
 3import os
 4import numpy as np
 5
 6import report.hwxpptxtypes as reporting
 7
 8session = hw.Session()
 9datadir = rf"{hm.altair_home}\demos\report\data"
10
11rep_ses = reporting.ReportSession()
12
13pres = reporting.Presentation()
14pres.template = os.path.join(
15    hm.altair_home, "mv/scripts/tcl/report/templates/pptTemplate.pptx"
16)
17
18slide1 = reporting.Slide(
19    "Report Demo | Table | Equation | Binary Image",
20    presentation=pres,
21)
22slide1.layout("One Table with Text and Image")
23
24# Create a Table, remove row 8 and column 2
25tab1 = reporting.Table("Table1")
26tab1.csvFile = os.path.join(datadir, "model_mass.csv")
27tab1.caption = "Entire Model Mass Statistics Summary."
28tab1.removeRow(8)
29tab1.removeColumn(2)
30# Merge two cells
31cell1 = tab1.cell(0, 0)
32cell2 = tab1.cell(1, 1)
33tab1.mergeCells(cell1, cell2)
34
35
36# Create a text with equations
37text1 = reporting.Text()
38text1.text = r"expr($\frac{d(x^5)}{dx} = 5 x^4$)"
39
40# Create an image from binary stream
41img_bin_path = os.path.join(datadir, "element_coordinate_system.png")
42with open(img_bin_path, "rb") as f:
43    img_bin = f.read()
44img1 = reporting.Image()
45img1.binarydata = np.frombuffer(img_bin, dtype=np.ubyte)
46
47# Add content to slide
48slide1.add(text1, "Text_1")
49slide1.add(tab1, "Table_1")
50slide1.add(img1, "Image_1")
51
52pres.savePPTX(open=True)
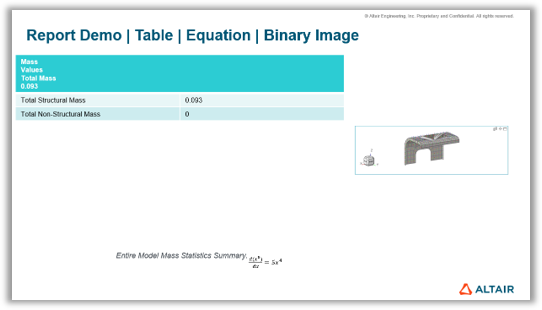
Figure 2. Slide with Table, Equation (Text) and Image