Create Charts
Use the New Chart dialog to plot your results.
Input Type
- From the Chart Manager, click
 to
display the New Chart dialog.
to
display the New Chart dialog.Figure 1. 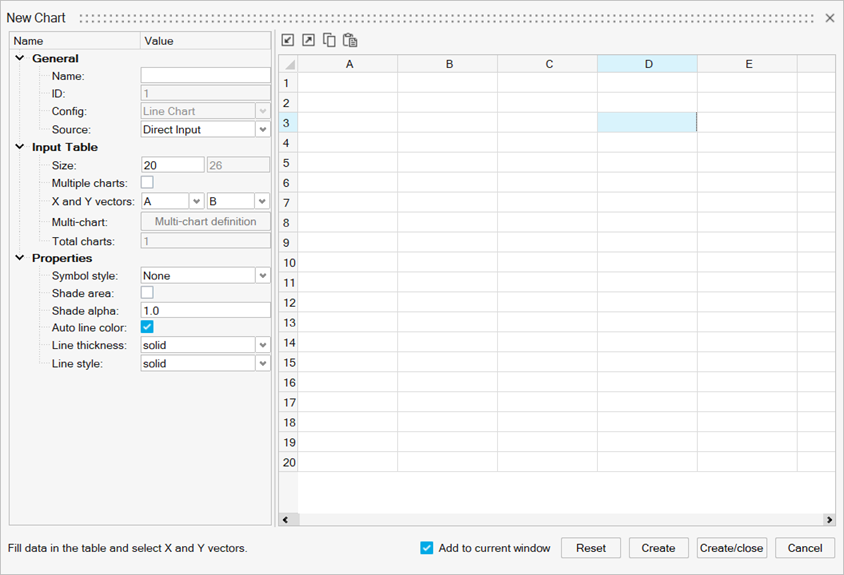
- Select to select one of the following the input types:
- Direct Input
- Use the Direct Input method to import data from a CSV file or enter values directly into the data table.
- HM table
- Use the HM table option to access tables that have been created using the Matrix Browser.
- Results
- Use HyperMesh results data and cross plotting options to create multiple charts from the X Vector and Y Vector table.
- Other data import and export options include:
- Click
 to import data from a CSV file.
 - Click
 to export the table's data to a CSV
file.
to export the table's data to a CSV
file. - Click
 or
or  to copy and paste data,
respectively.
to copy and paste data,
respectively. - You can also right-click within a table cell to display the table's context menu.
-
Figure 2. 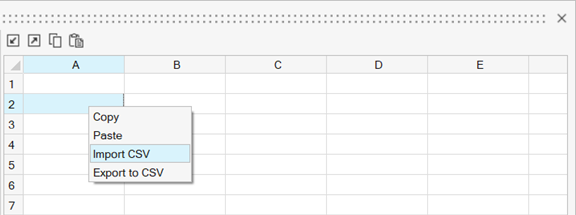
- Click
Options
Define the following options before creating your plot.
- General
-
- Name
- The name of the chart.
- ID
- The next available ID (non-editable field).
- Config
- The chart type (non-editable field). Line chart is the default.
- Source
- Select the source type. Options include Direct Input, HM table, and Results.
- Entity IDs
- Click the entity selector to select
nodes or elements from the model based on specific results.
When selected, the Chart Manager
dialogs are minimized to enhance the selection process. Upon
making your selections, click
 . The Chart Manager is displayed with the
selected node and element IDs.
. The Chart Manager is displayed with the
selected node and element IDs. - Load cases
- Select Current Simulation, Current Subcase, or Advanced Selections for the load case type.
- Input Table
- The Input Table section is displayed when you select the
Direct Input and HM
table source types. Some options change, depending on
the input type selected.
- Size
- The number of entries in the data table. You can only change the number of rows.
- HM table
- If you select HM table for the source
type, this field is displayed. From the drop-down menu,
select the HyperMesh table that
you created using the Matrix Browser.
Figure 3. 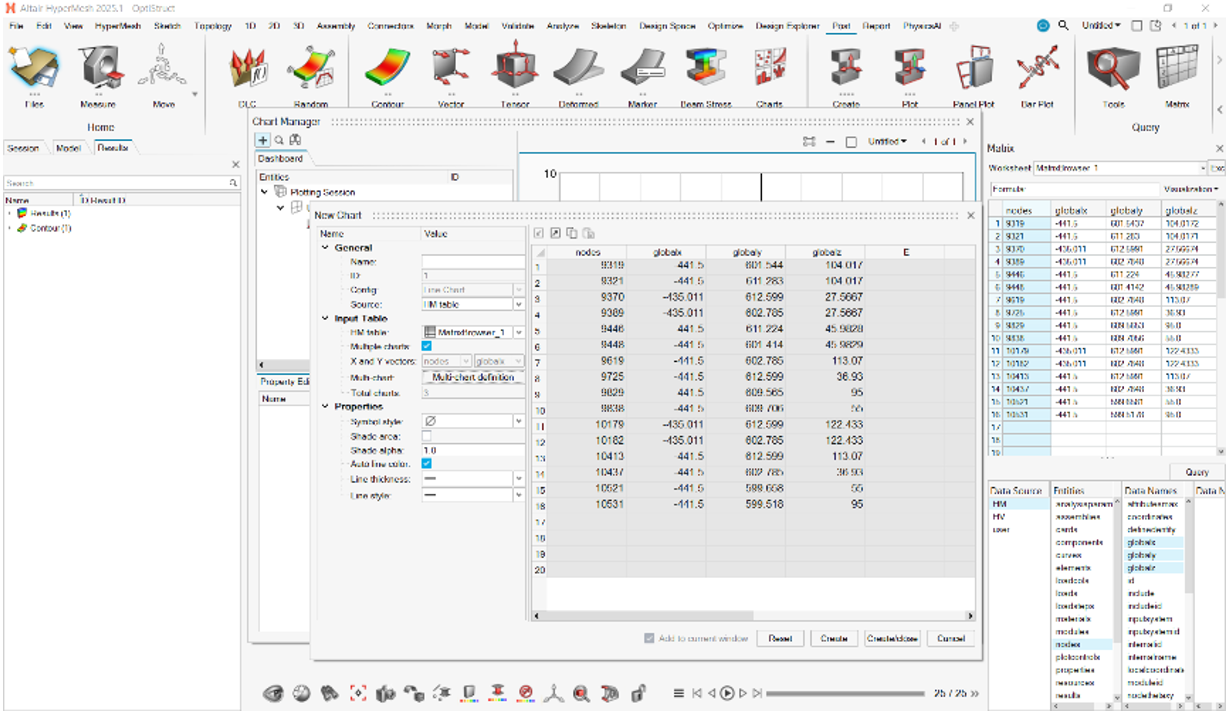
- Multiple charts/Multi-chart
- Activate this option to define multiple charts and output them simultaneously.
- Click Multi-chart Definition to
display the following dialog:
Figure 4. 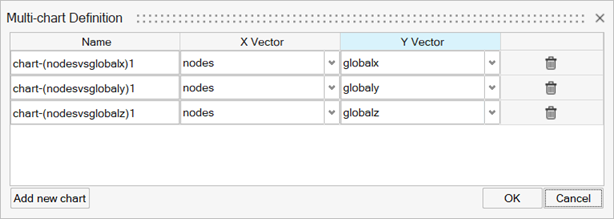
- X and Y vectors
- Define the columns for the X and Y vector values.
- Total charts
- The total number of charts that you have created. The value changes if Multiple charts is selected.
- Results
- From the Source menu, select Results. Use results
data and cross plotting options to create multiple charts from the X
Vector and Y Vector table.
Figure 5. 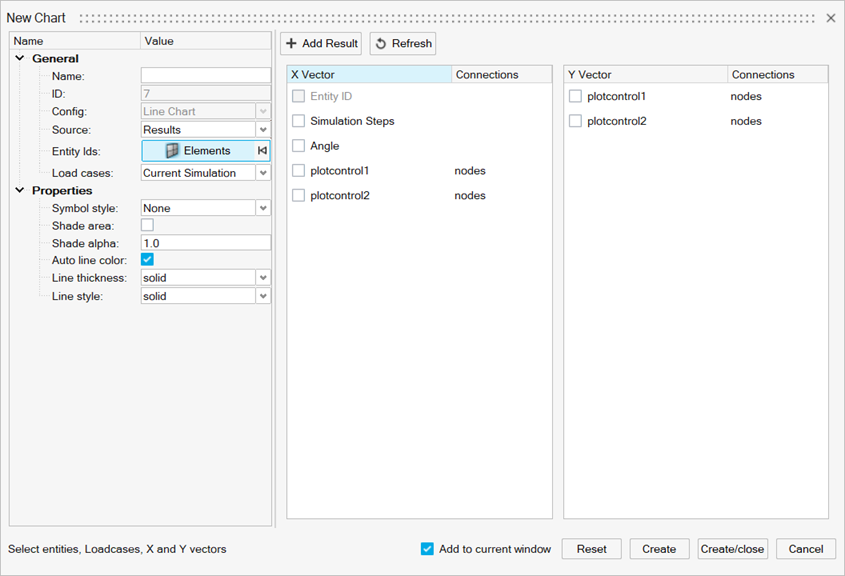
-
- Entity IDs
- Select nodes or elements from model. During this process, the Chart Manager dialogs are minimized to simplify your selections.
- On the guide bar, click
 to apply your selections, close
the tool, and return to the Chart Manager.
to apply your selections, close
the tool, and return to the Chart Manager. - Click
 to exit the tool without
applying your selections.
to exit the tool without
applying your selections. - Load cases
- Select one of the following types:
- Current Simulation
- Current Subcase
- Advanced Selections. If selected, click ResultSimulation to display the Select Results Simulation dialog. From this dialog, select the simulation to plot.
- Properties
- Use the following options to define the chart's properties.
- Symbol style
- Symbols can be placed on a curve to indicate data points. Select a symbol type from the list.
- Shade area
- Fills the area under the curve with a solid color.
- Shade alpha
- Auto line color
- Automatically determines the line color. Deselect this option to specify the line color.
- Line thickness
- Select a line thickness for the curve.
- Line style
- Select a line style for the curve.
- Reset
- Removes your selections and resets the New Chart dialog.
- Create
- Creates charts while keeping the New Chart dialog open.
- Create/close
- Creates charts and closes the New Chart dialog.
- Cancel
- Closes the New Chart dialog without applying any data input.