Random Response
Use the Random Response tool to perform a random response analysis using an existing FRF file.
- From the Create tools, select .
Figure 1. Random Response Dialog 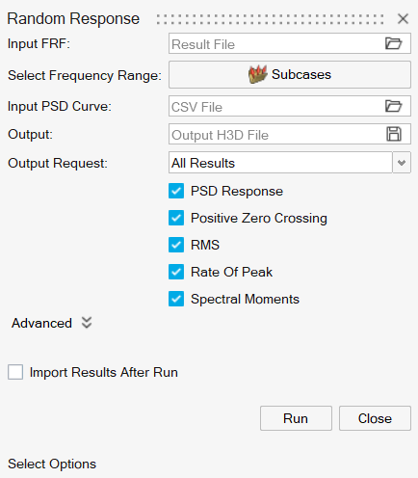
- For Input FRF, click
 and browse
and select a result file with FRF subcases.Note: Currently, the supported solvers are OptiStruct (.op2, .h3d) and Nastran (.op2).
and browse
and select a result file with FRF subcases.Note: Currently, the supported solvers are OptiStruct (.op2, .h3d) and Nastran (.op2). - Select a subcase and a preferred frequency range.
- For Select Frequency Range, click Subcases.
The Select Subcase dialog opens displaying a list of complex subcases and their frequencies.
- Select one subcase and a preferred frequency range.
Figure 2. Select Subcase Dialog 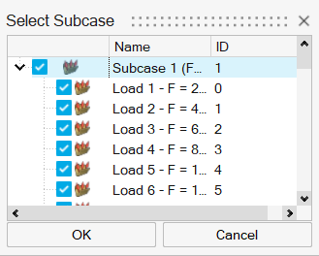
- Click OK.
- For Select Frequency Range, click Subcases.
- For Input PSD Curve, click and browse
and select a .csv file with a PSD curve.Note: The .csv file must have the following two-column layout with headers:
Figure 3. CSV File Layout Example 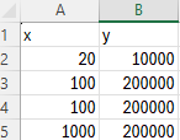
The first column represents the frequencies and should include the range of frequencies that are selected in the Select frequency range option (see Step 3). The second column represents the PSD load.
- For Output, click and browse
and select the output directory and result file.
- For Output Request, Select result data types and components to be exported in the
output file.
- All Results
- All result data types and their components will be exported in the output file.
- Select Results
- Select preferred result data types and components to be exported in the output
file. By default, all results are selected.
Figure 4. Select Results 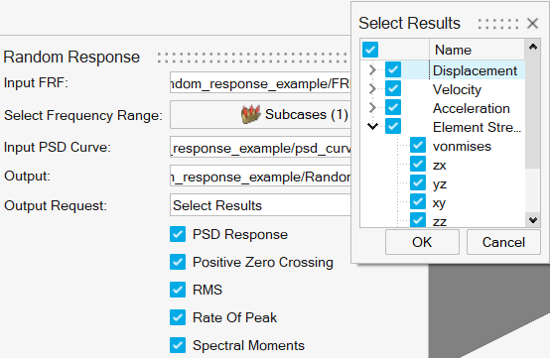
- Select the preferred result calculations to be done.
- PSD Response
- Positive Zero Crossing
- RMS
- Rate of Peak
- Spectral Moments
- Click
 and define Advanced options.
- Select an axis scale type from linear and logarithmic.
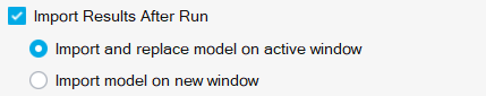
- Select Import Files After Run to import a output result file of
the random response analysis in the active window if the model file is already
imported.Note: The second option is only available for a page layout that has less than four windows.
Figure 5. Import Results After Run Option