Altair PhysicsAI 2025.1 Release Notes
Announcements
PhysicsAI is now spelled with a capital P; physicsAI is no longer in use.
New Features
- New Architecture: Shape Encoding Regressor
- The Shape Encoding Regressor (SER) architecture uses the shape encodings
of the training samples to fit multiple regressions. The predictions are
restricted to scalar KPIs and vector curves (no contour results).
Figure 1. 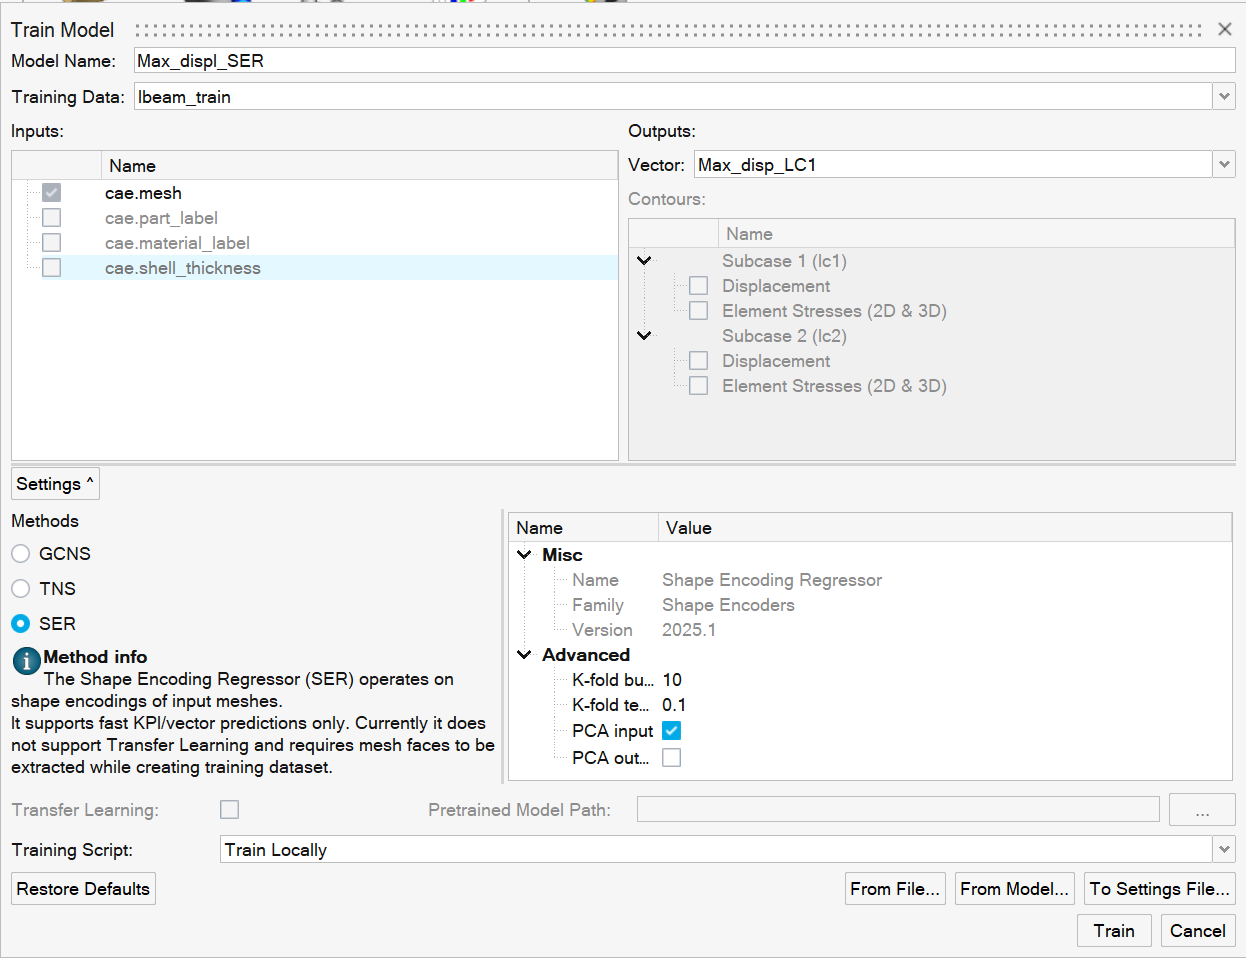
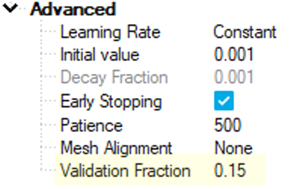
- User Input Validation Fraction
- Validation datasets are useful in preventing overfitting on large datasets. However, on small datasets it can lead to the selection of a suboptimal epoch as the best model configuration.
Enhancements
- Element Corner Data Support
- Element corner data can now be read into PhysicsAI.
- Similarity Score for Curve Prediction
- Similarity score is now available for curve predictions.
Figure 3. 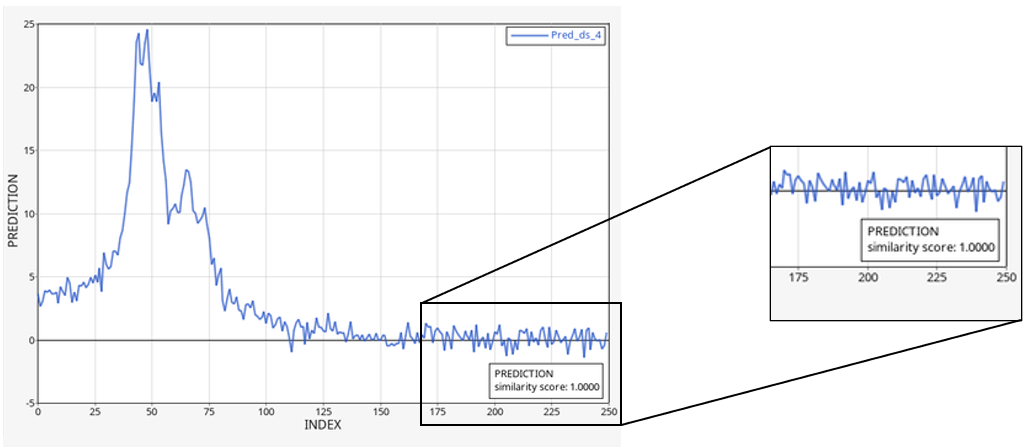
- Enhanced Data Curation Capabilities
- The data curation features (part of dataset creation) have been
significantly enhanced. The updates can be divided into two categories:
data inspection and data management.
- Data Inspection
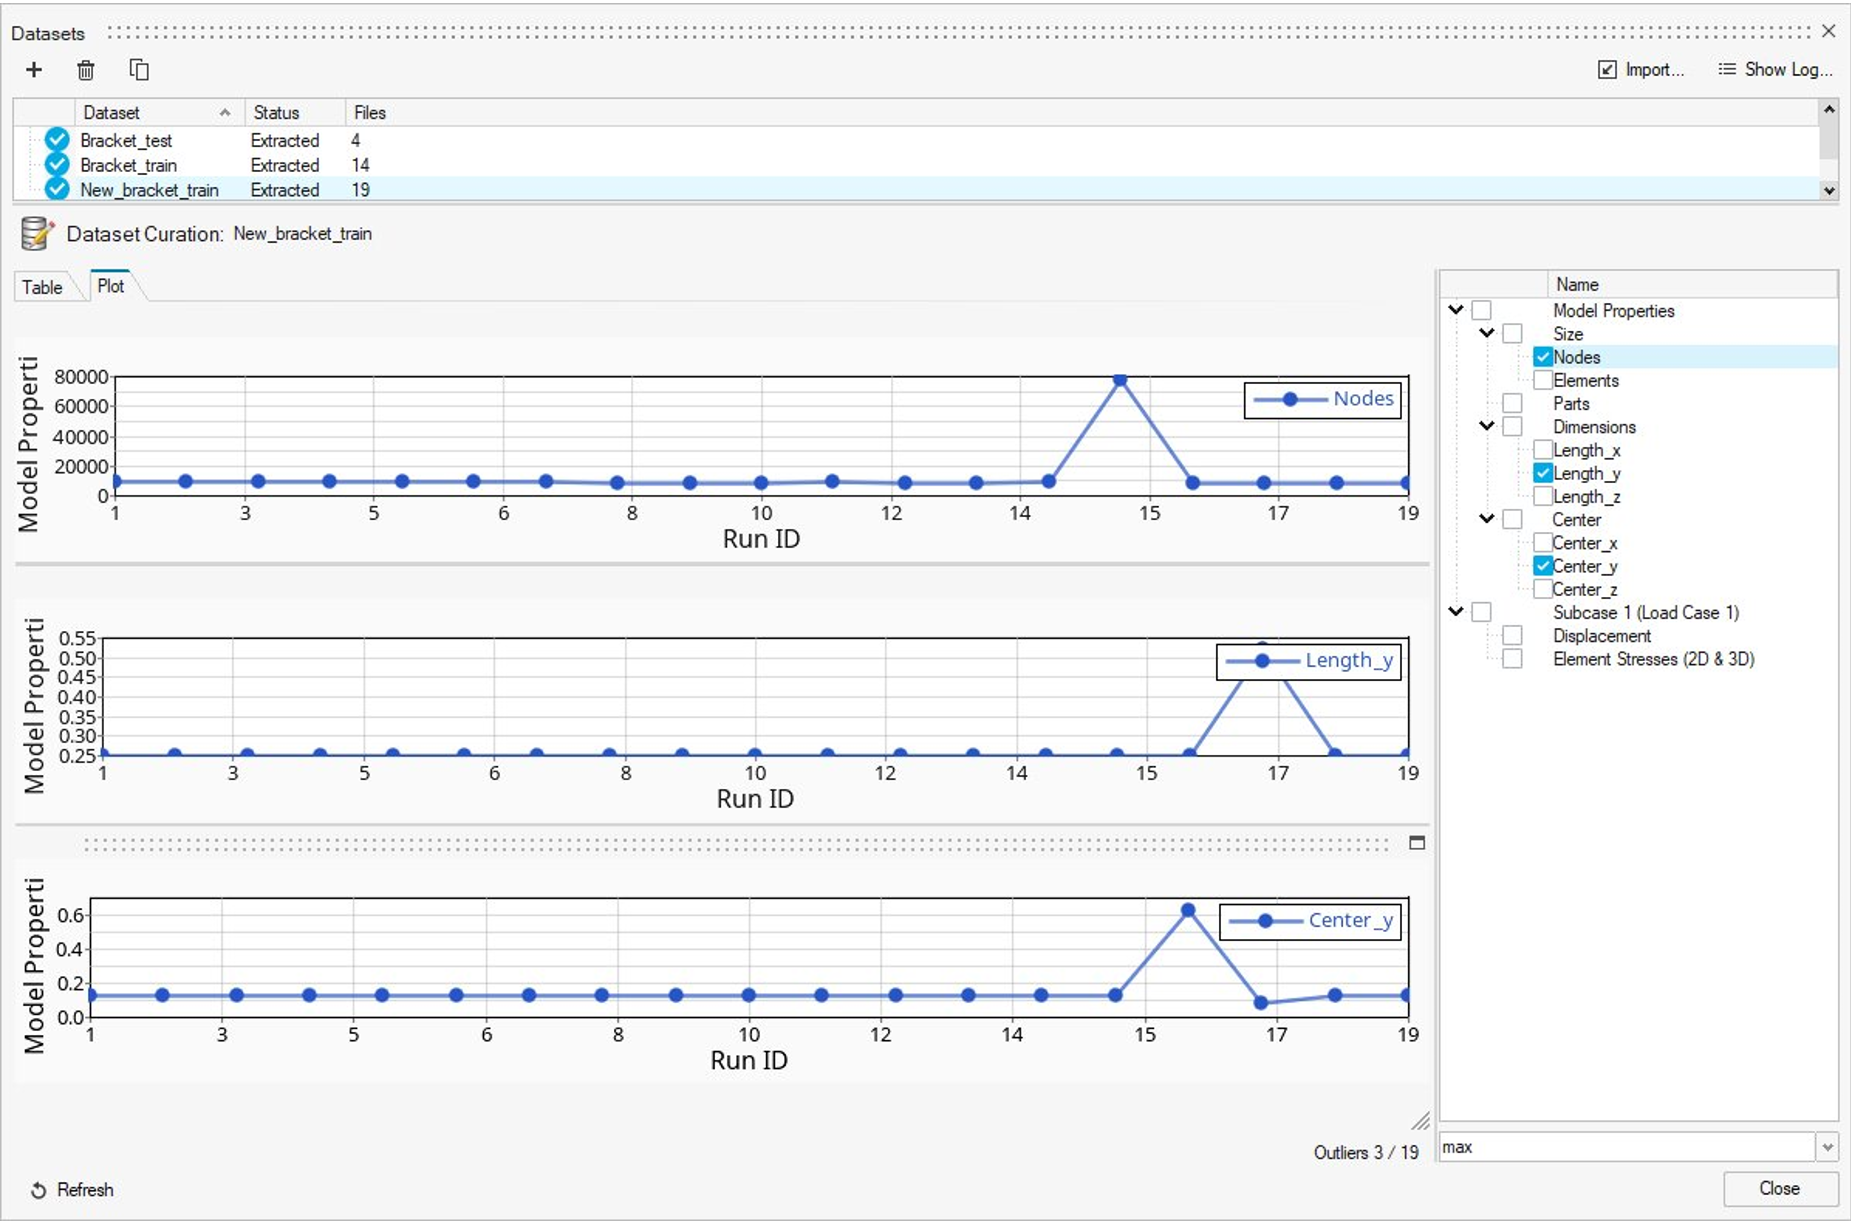
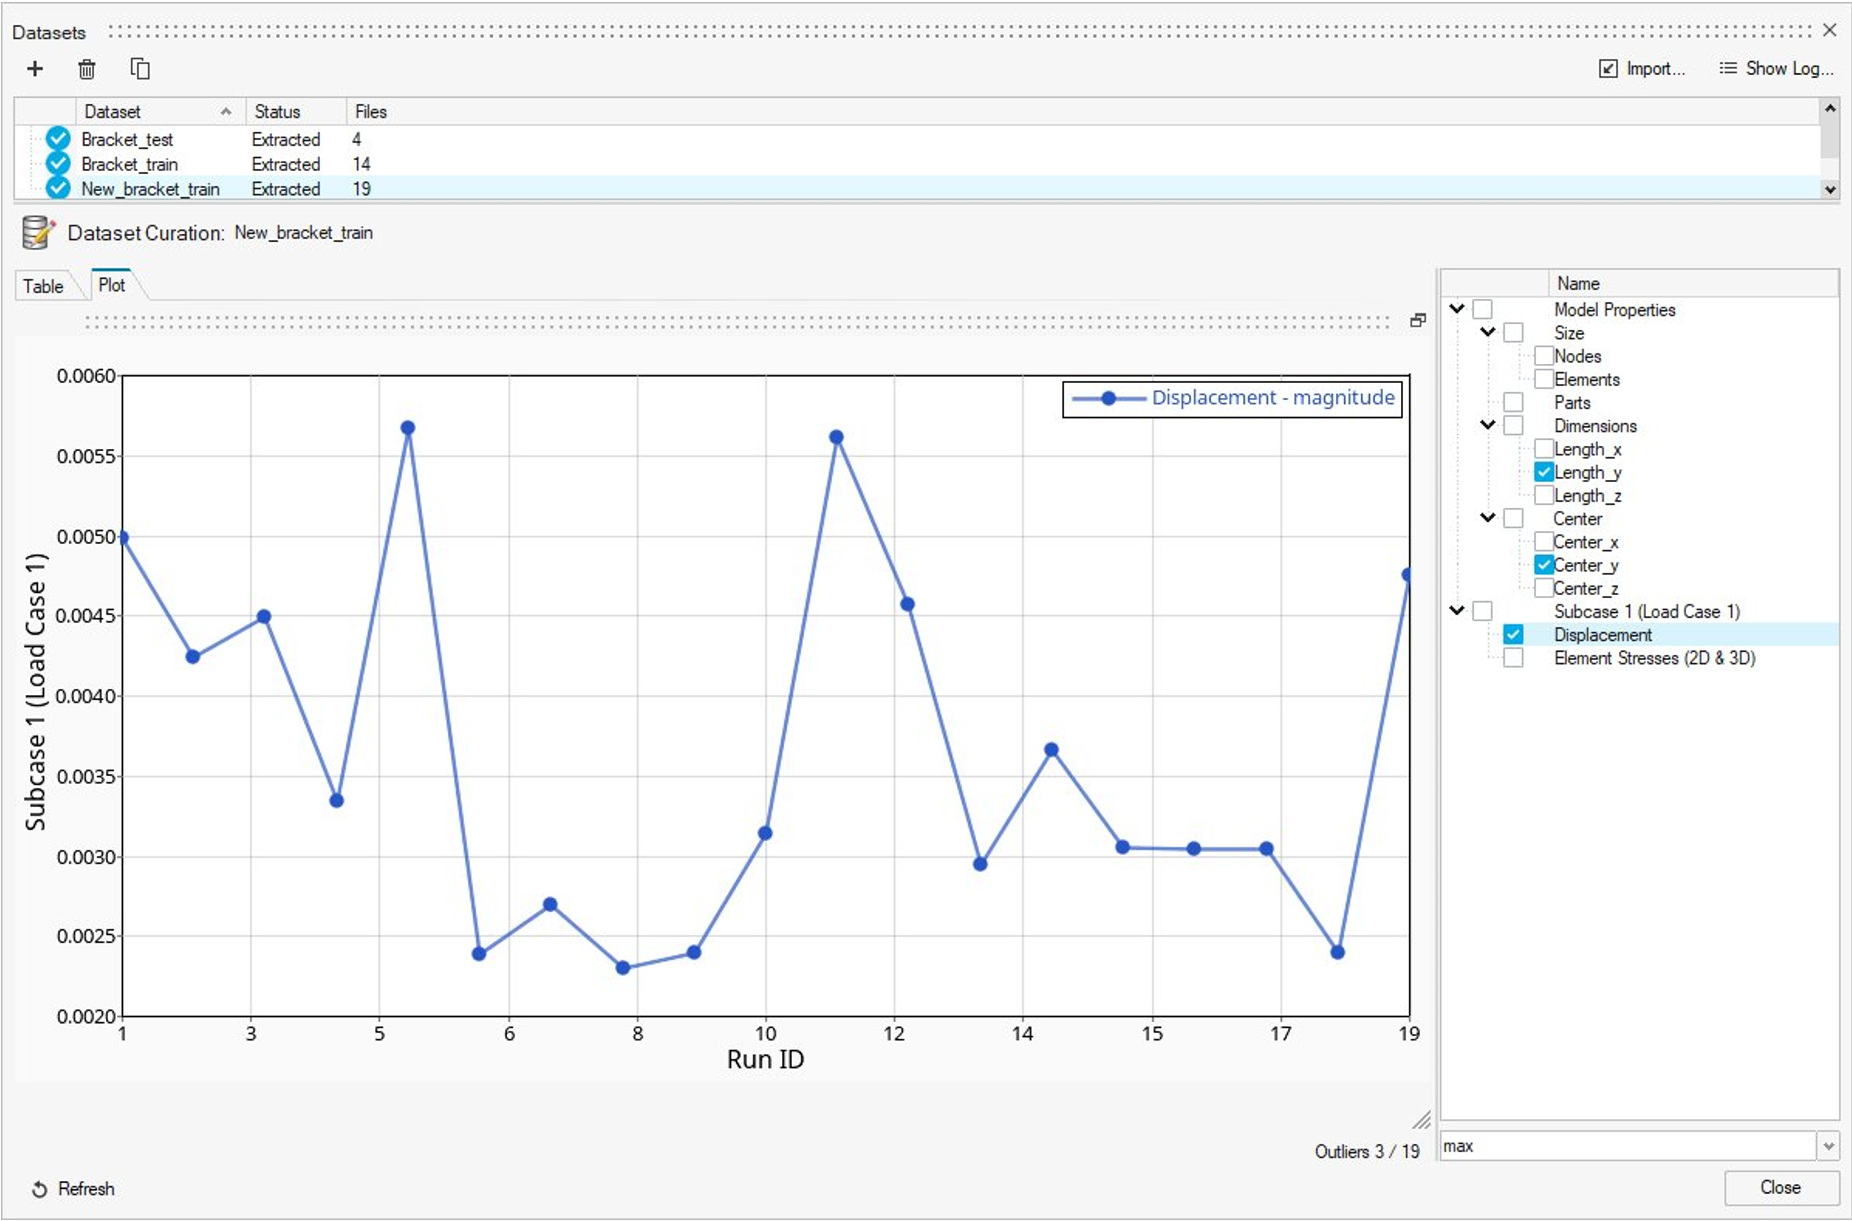
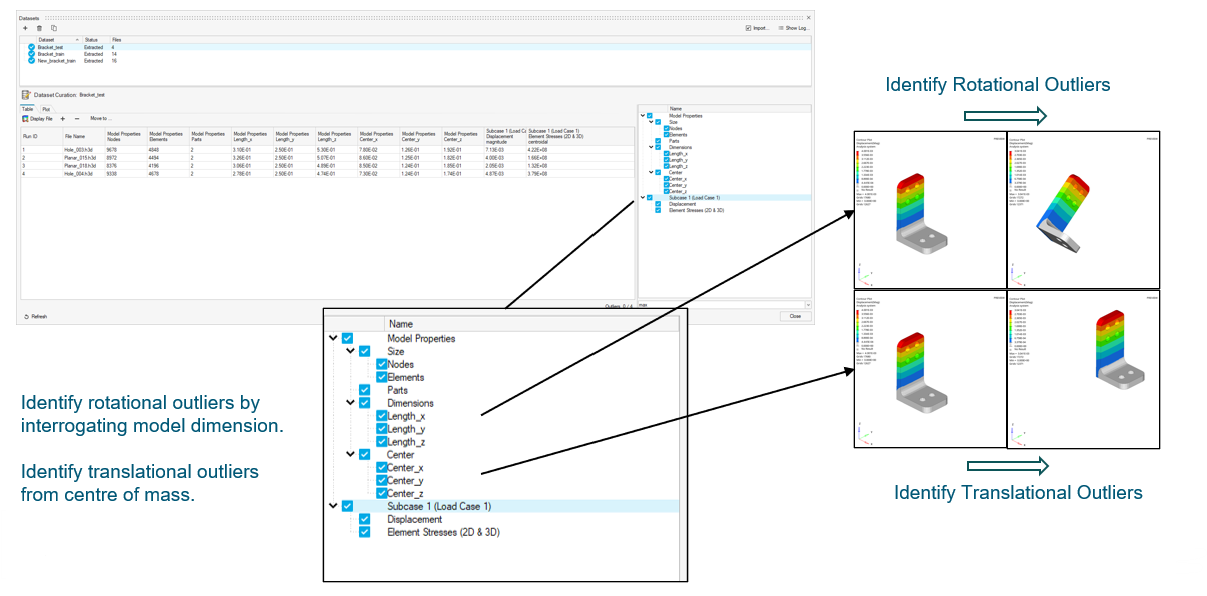
- Updates to the model summary and results metrics table:
outliers are now automatically identified and highlighted in
orange. The outlying columns are also displayed. The
outlying KPI value is highlighted in bold font. You can
select or remove additional responses by interacting with
the tree shown on the right side of Figure 4.
Figure 4. 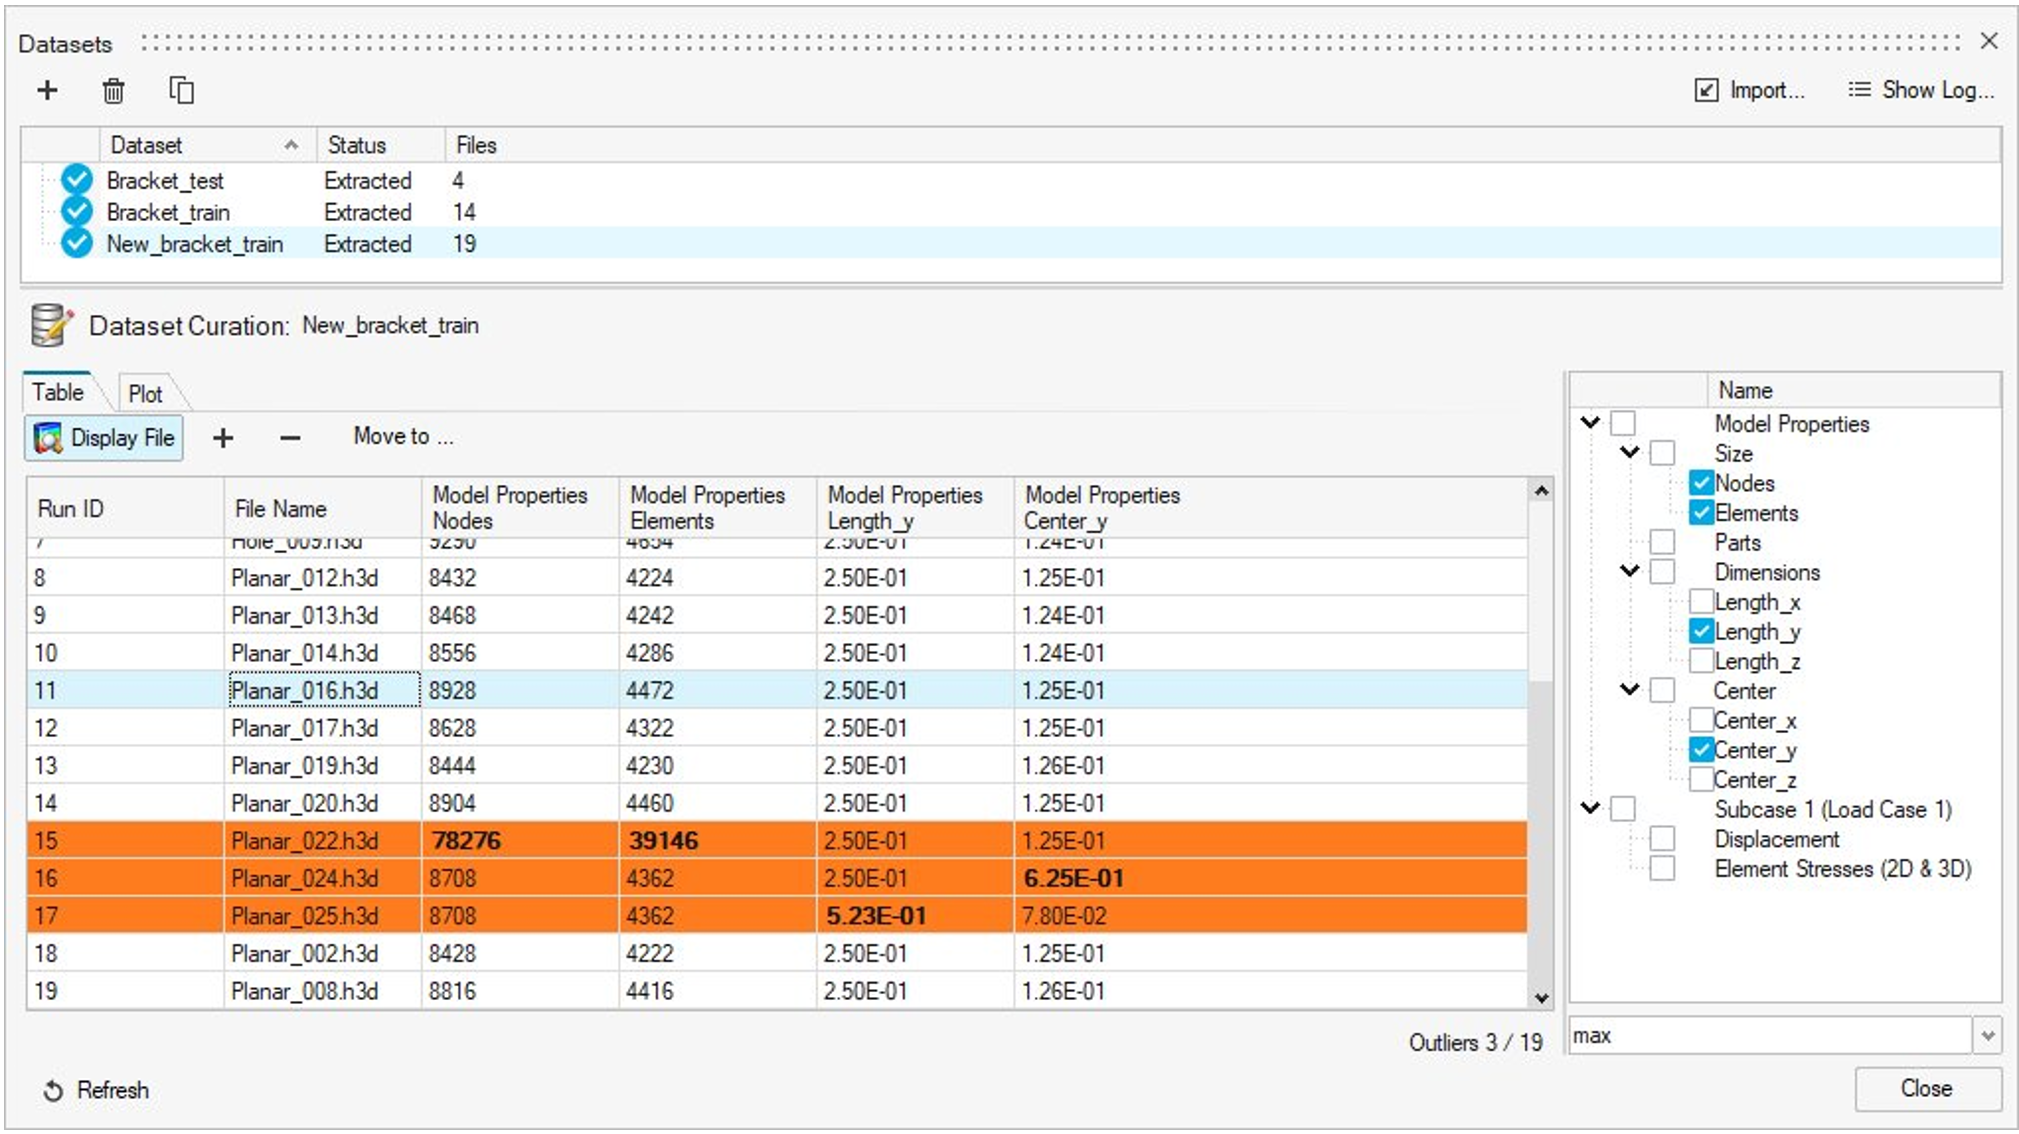
- Data Management
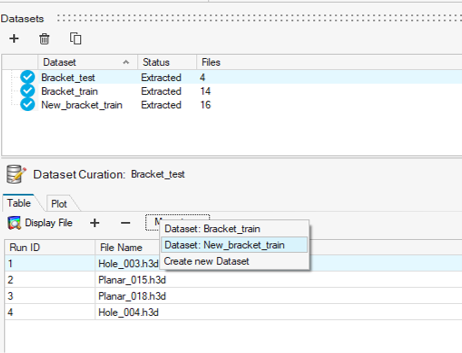
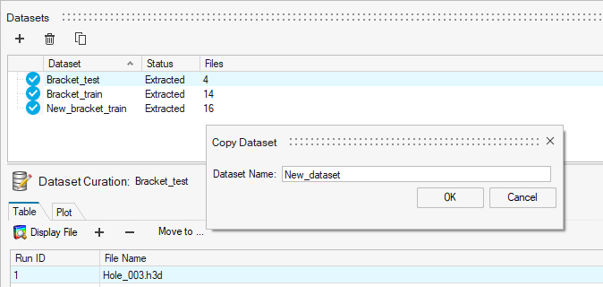
- Datasets can now be edited to add more samples or remove
outliers.
Figure 8. 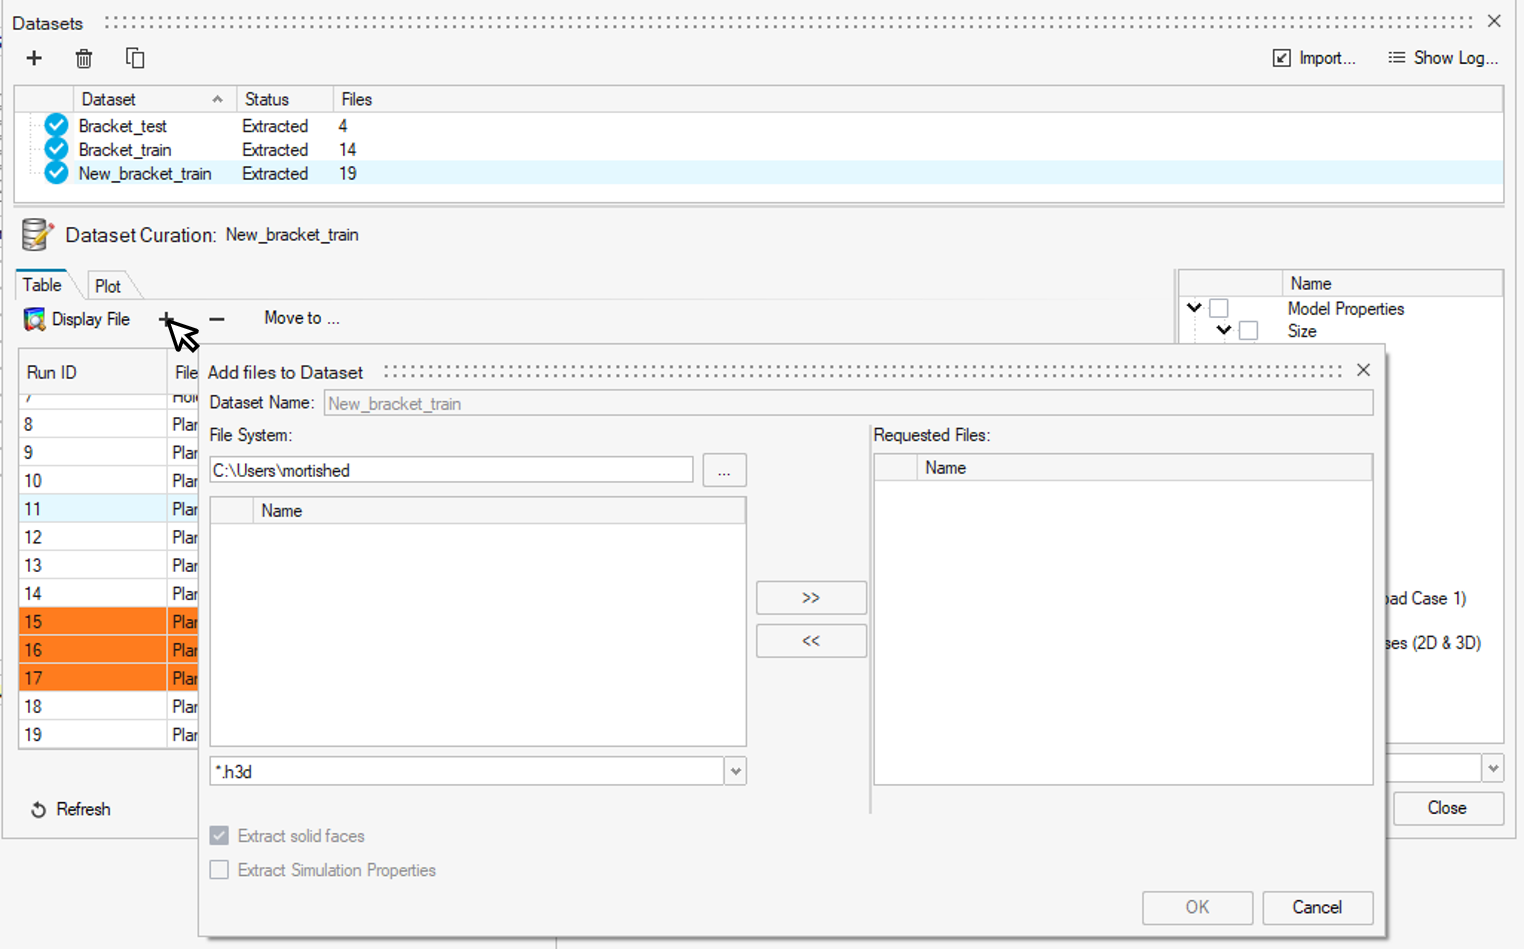
Figure 9. 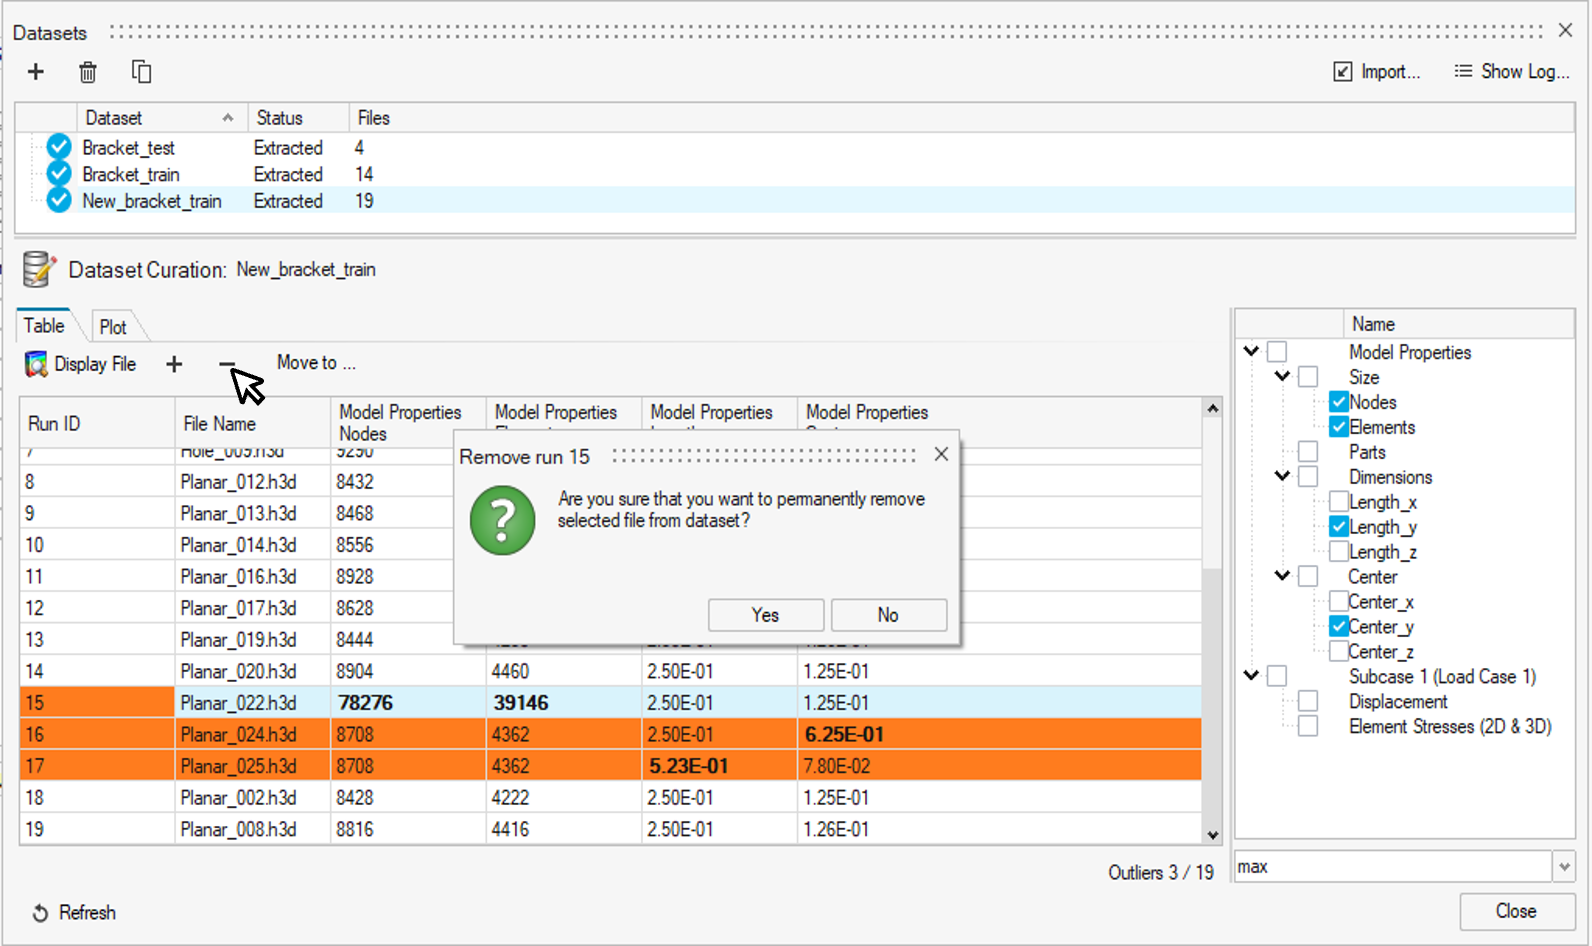
- KPI and Curve Prediction Visualization in HyperMesh CFD
- The PhysicsAI ribbon inside HyperMesh CFD can now display
the predicted curves and KPI.
Figure 12. 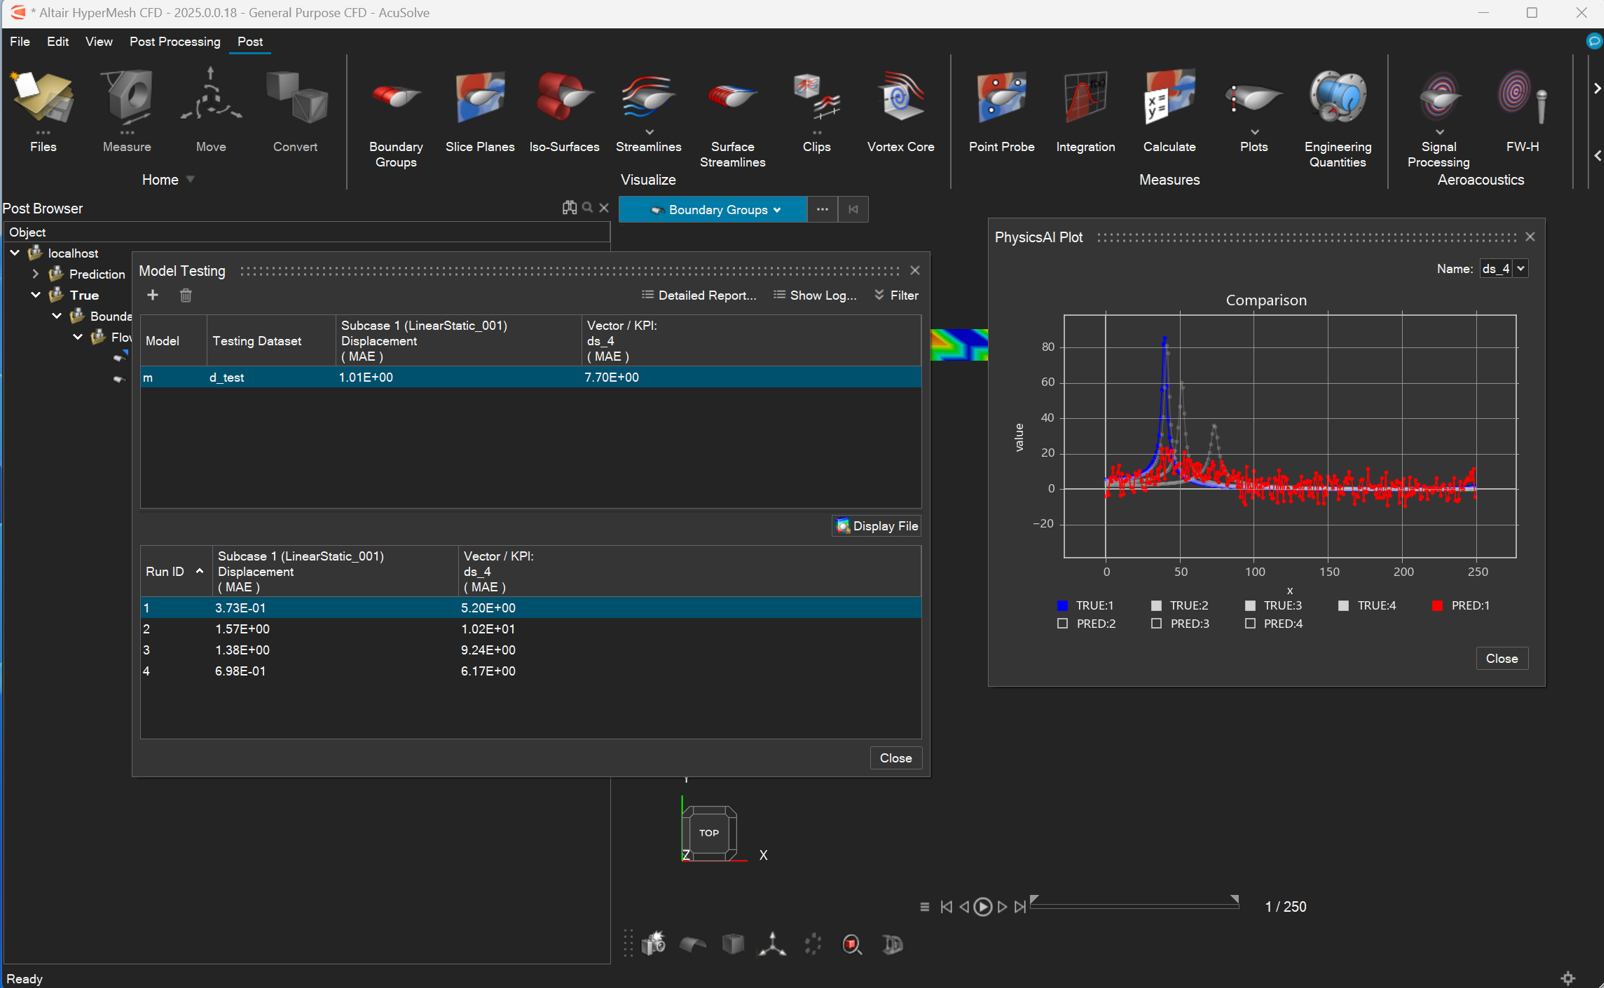
- Faster Predictions
- Prediction time on new designs now takes 50% less time
compared to earlier versions.
Figure 13. 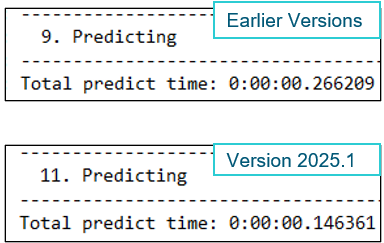
Resolved Issues
- Memory issues have been fixed that used to cause a varying memory requirement for dataset creation. Now, a constant memory will be consumed during dataset creation.
Known Issues
- On Linux, PhysicsAI 2025.1 requires a mandatory update of cuDNN to 8.9.7. Not updating cuDNN may lead to inadvertent training with a CPU despite expecting training with a GPU.
- Projects that contain a model which has an error state will not open correctly on the first try. Such projects will open correctly if reopened a second time as part of the same session.
