View Appliance Status
Monitor default and shared appliance and its node statuses on the Altair One platform.
- Login to Altair One.
- Click .
-
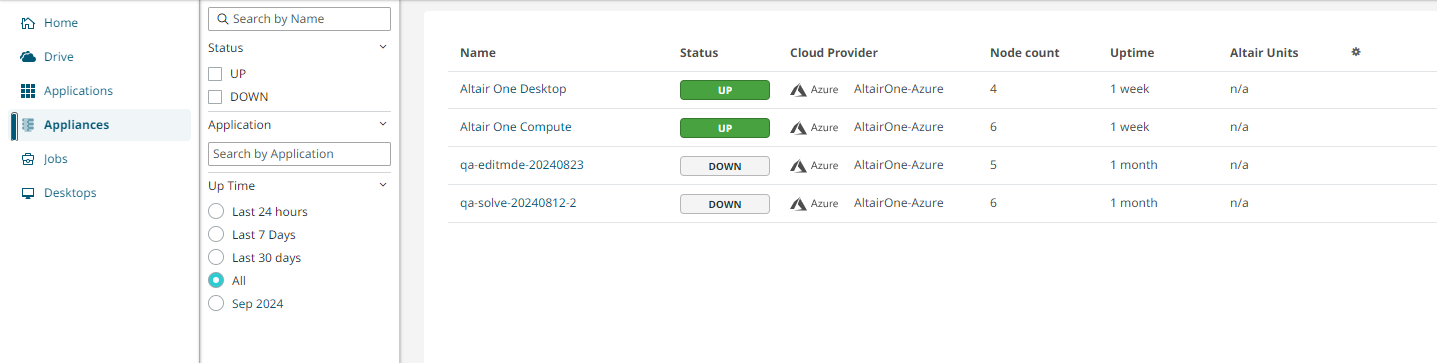
Click Appliances in the left navigation pane.
List of appliances with its node status is displayed:
Figure 1. Altair One Appliance Status