Curve Basics#
Some examples require external input files. Before you start, please follow the link in the Example Scripts section to download the zip file with model and result files.
Example 01 - Curves from Expression#
Create two curves from math expressions#
 1import hw
 2import hw.hg as hg
 3import os
 4
 5ses = hw.Session()
 6ses.new()
 7win = ses.get(hw.Window)
 8win.type = "xy"
 9
10exprXlist = ["0:1:0.0001", "c1.x"]
11exprYlist = ["sin(x*2*PI)", "c1.y+0.2*sin(60*x*2*PI)"]
12labelList = ["Basic Oscillation 1 HZ", "Overtone 60 HZ"]
13
14for exprX, exprY, label in zip(exprXlist, exprYlist, labelList):
15    cu = hg.CurveXY(
16        xSource="math",
17        xExpression=exprX,
18        ySource="math",
19        yExpression=exprY,
20        label=label,
21    )
22
23win.update()
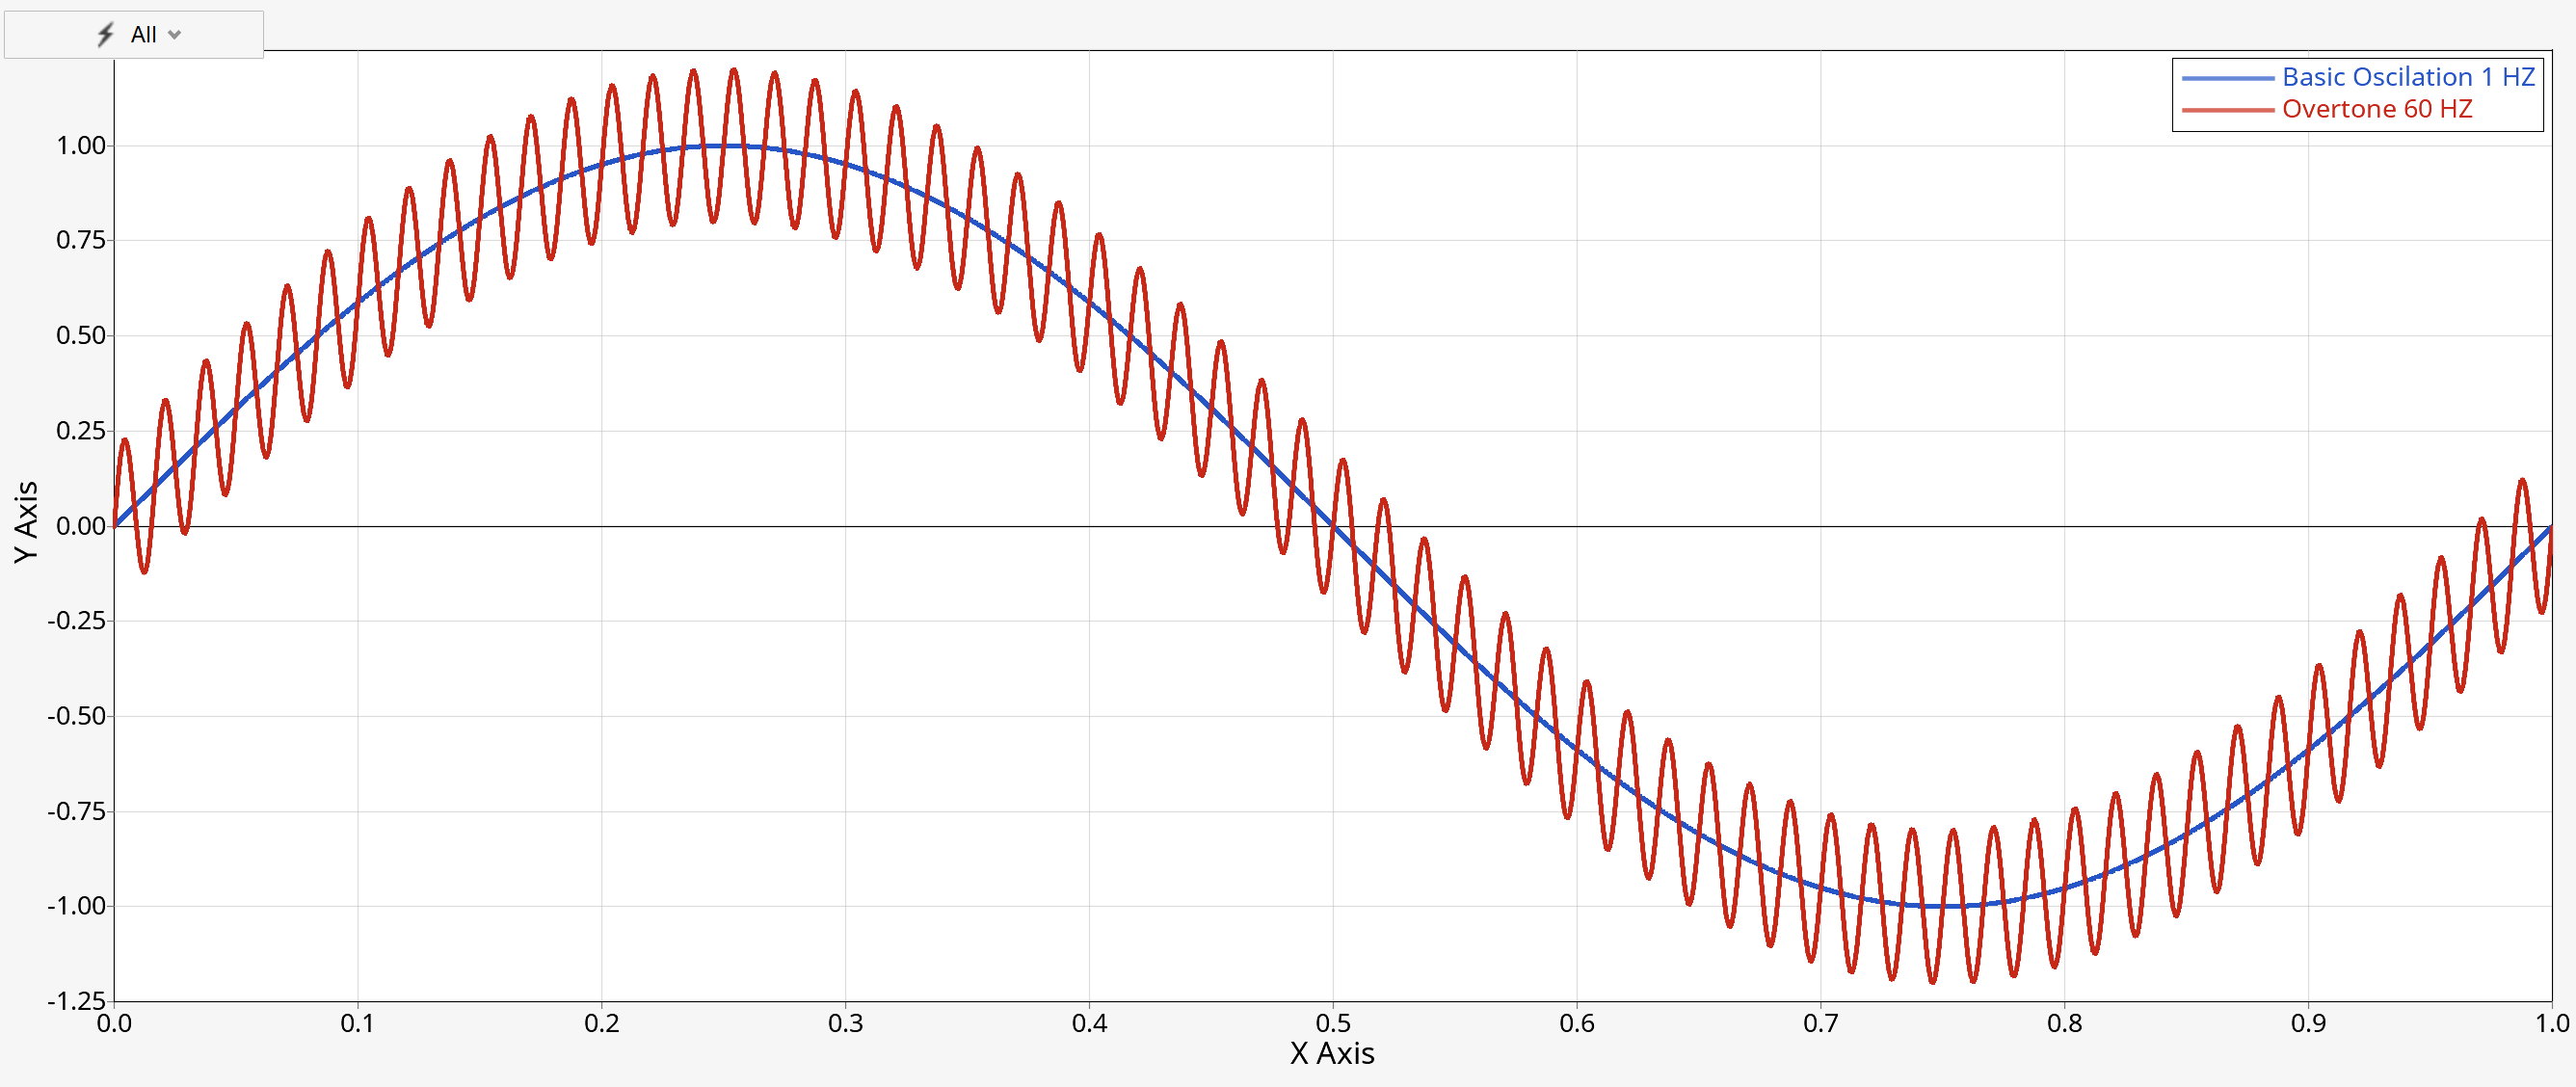
Figure 1. Output of ‘Create two curves from math expressions’
Example 02 - Curves from File#
Load two curves from file, define color and label#
 1import hw
 2import hw.hg as hg
 3import os
 4
 5ALTAIR_HOME = os.path.abspath(os.environ["ALTAIR_HOME"])
 6plotFile = os.path.join(
 7    ALTAIR_HOME, "demos", "mv_hv_hg", "plotting", "madymo", "ANGACC"
 8)
 9
10ses = hw.Session()
11ses.new()
12win = ses.get(hw.Window)
13win.type = "xy"
14
15requestList = ["50th% Hybrid3   - LOWER TORSO", "50th% Hybrid3   - UPPER TORSO"]
16colorList = [(255, 0, 0), (0, 0, 255)]
17
18for color, request in zip(colorList, requestList):
19    cu = hg.CurveXY(
20        xFile=plotFile,
21        xSource="file",
22        xDataType="Time",
23        xRequest="Time",
24        xComponent="Time",
25        yFile=plotFile,
26        ySource="file",
27        yDataType="Angular Acceleration",
28        yRequest=request,
29        yComponent="Res. ang. acc.",
30        lineColor=color,
31        label="{y.HWRequest} - {y.HWComponent}",
32    )
33
34win.update()
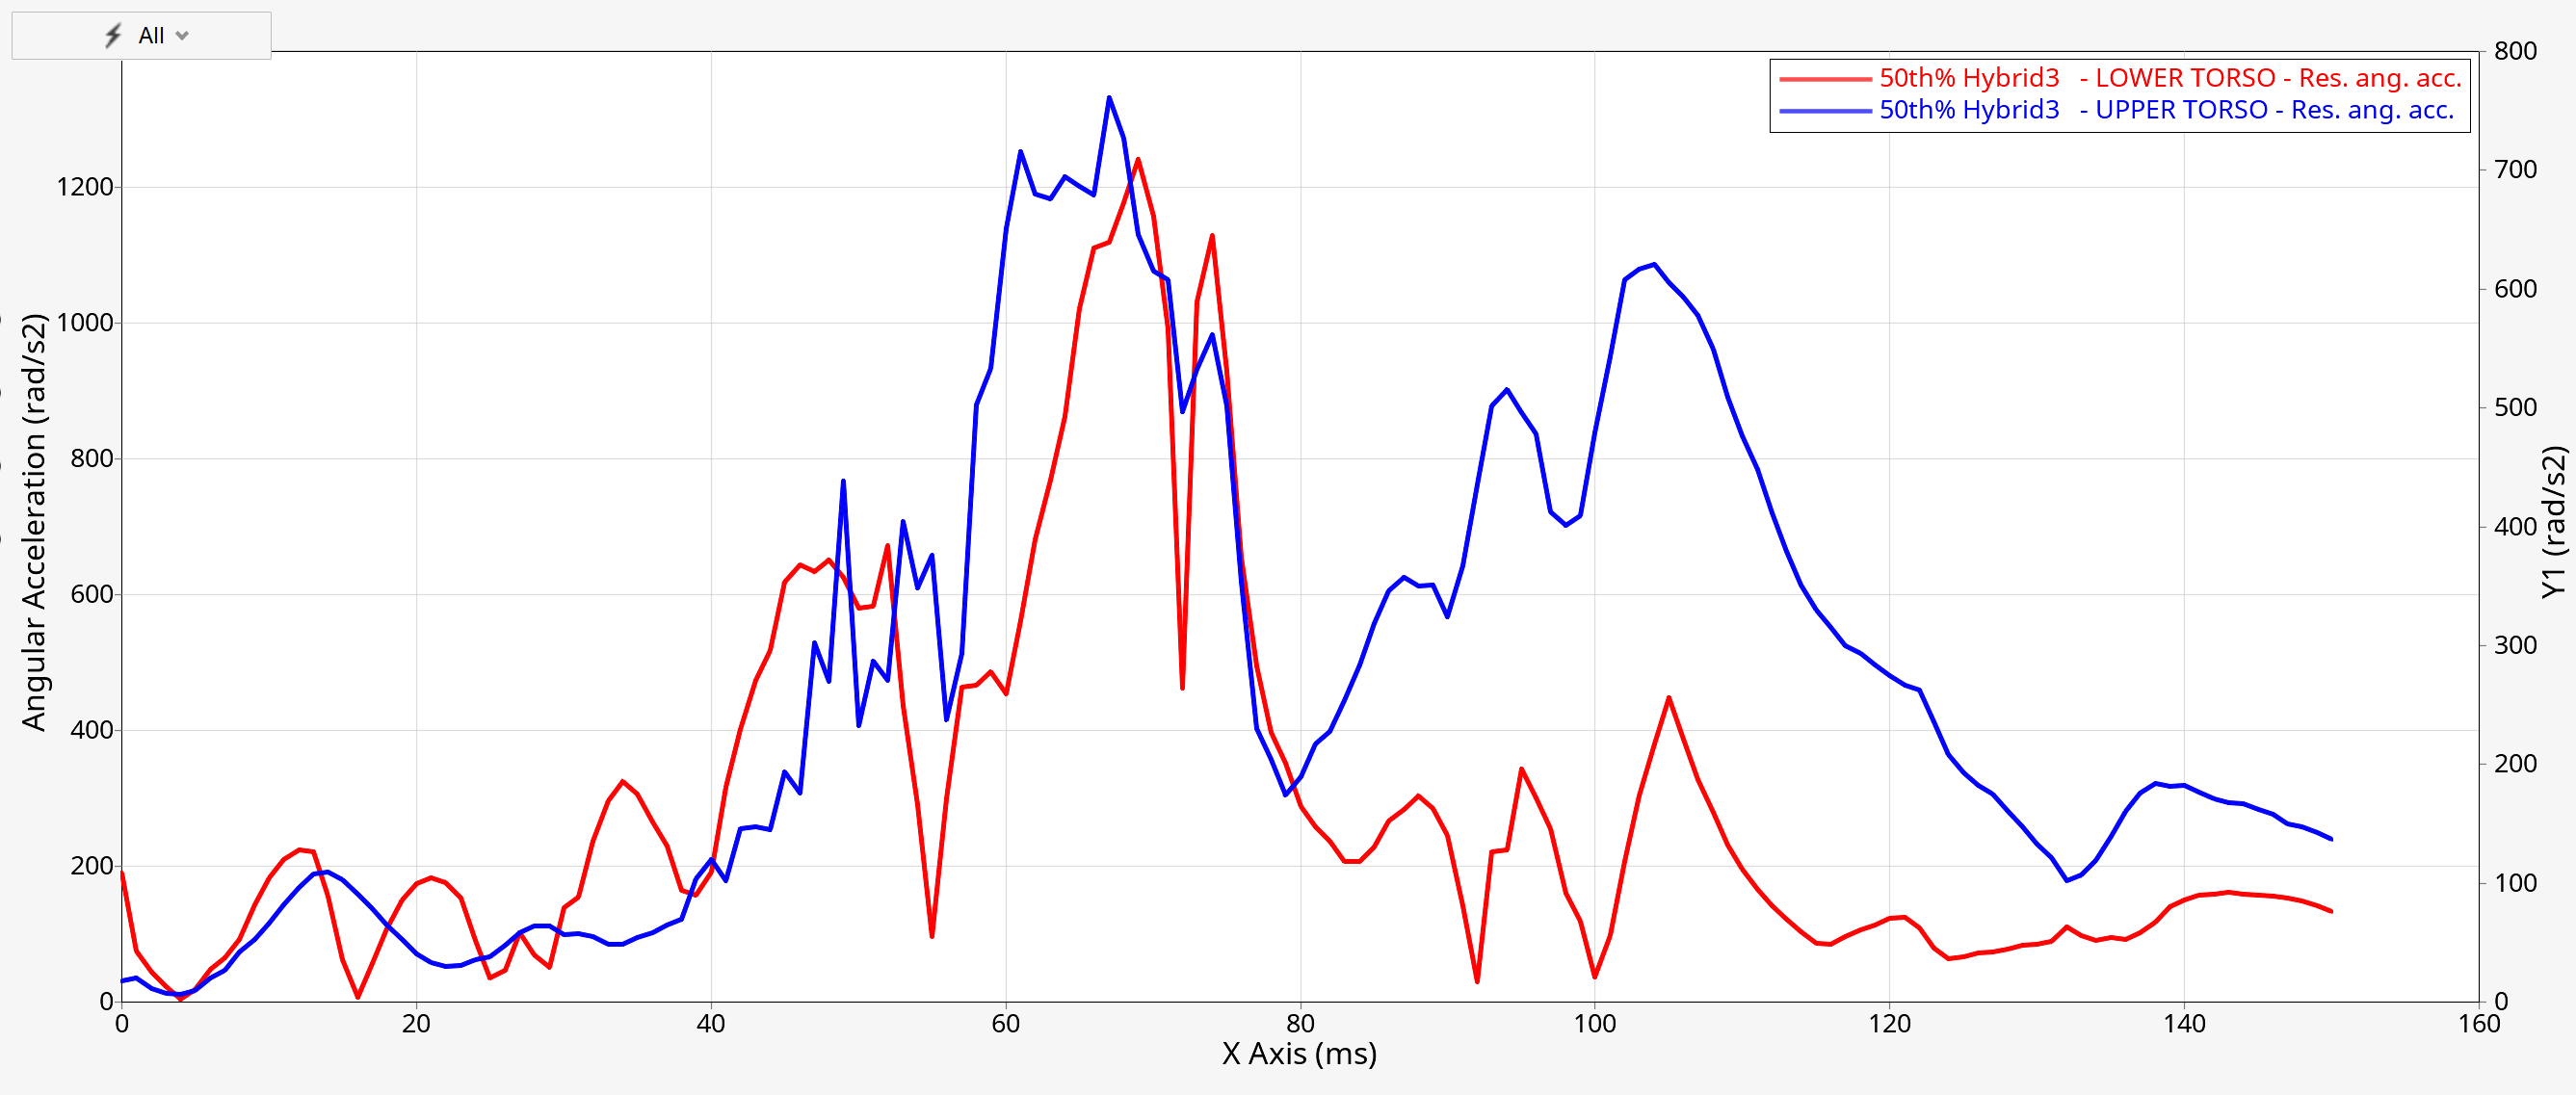
Figure 2. Output of ‘Load two curves from file, define color and label’
Example 03 - Complex Curve#
Create and edit complex curves#
 1import hw
 2import hw.hg as hg
 3import os
 4
 5scriptDir = os.path.abspath(os.path.dirname(__file__))
 6plotFile = os.path.join(scriptDir, "plot", "control_arm_sol111.pch")
 7
 8s = hw.Session()
 9s.new()
10# evalHWC('hwd window type="HyperGraph 2D"')
11w = s.get(hw.Window)
12w.type = "complex"
13w.axisMode = "ri"
14
15yrCompList = ["REL | X-Trans", "REL | Y-Trans", "REL | Z-Trans"]
16yiCompList = ["IMG | X-Trans", "IMG | Y-Trans", "IMG | Z-Trans"]
17colorList = ["#ff0000", "#00ff00", "#0000ff"]
18
19for yrComp, yiComp, color in zip(yrCompList, yiCompList, colorList):
20    cu = hg.CurveComplex(
21        xFile=plotFile,
22        label="{y.HWRequest} - {y.HWComponent}",
23        xSource="file",
24        xDataType="Frequency [Hz]",
25        xRequest="Frequency [Hz",
26        xComponent="Frequency [Hz",
27        yrFile=plotFile,
28        yrSource="file",
29        yrDataType="Displacements",
30        yrRequest="Point id 2086",
31        yrComponent=yrComp,
32        yiFile=plotFile,
33        yiSource="file",
34        yiDataType="Displacements",
35        yiRequest="Point id 2086",
36        yiComponent=yiComp,
37        lineColor=color,
38        window=1,
39        page=1,
40    )
41
42cu.shadeArea = True
43cu.shadeStyle = "betweenCurves"
44cu.shadeSecondCurve = 2
45cu.shadeColor = (0, 0, 0)
46cu.shadeAlpha = 0.2
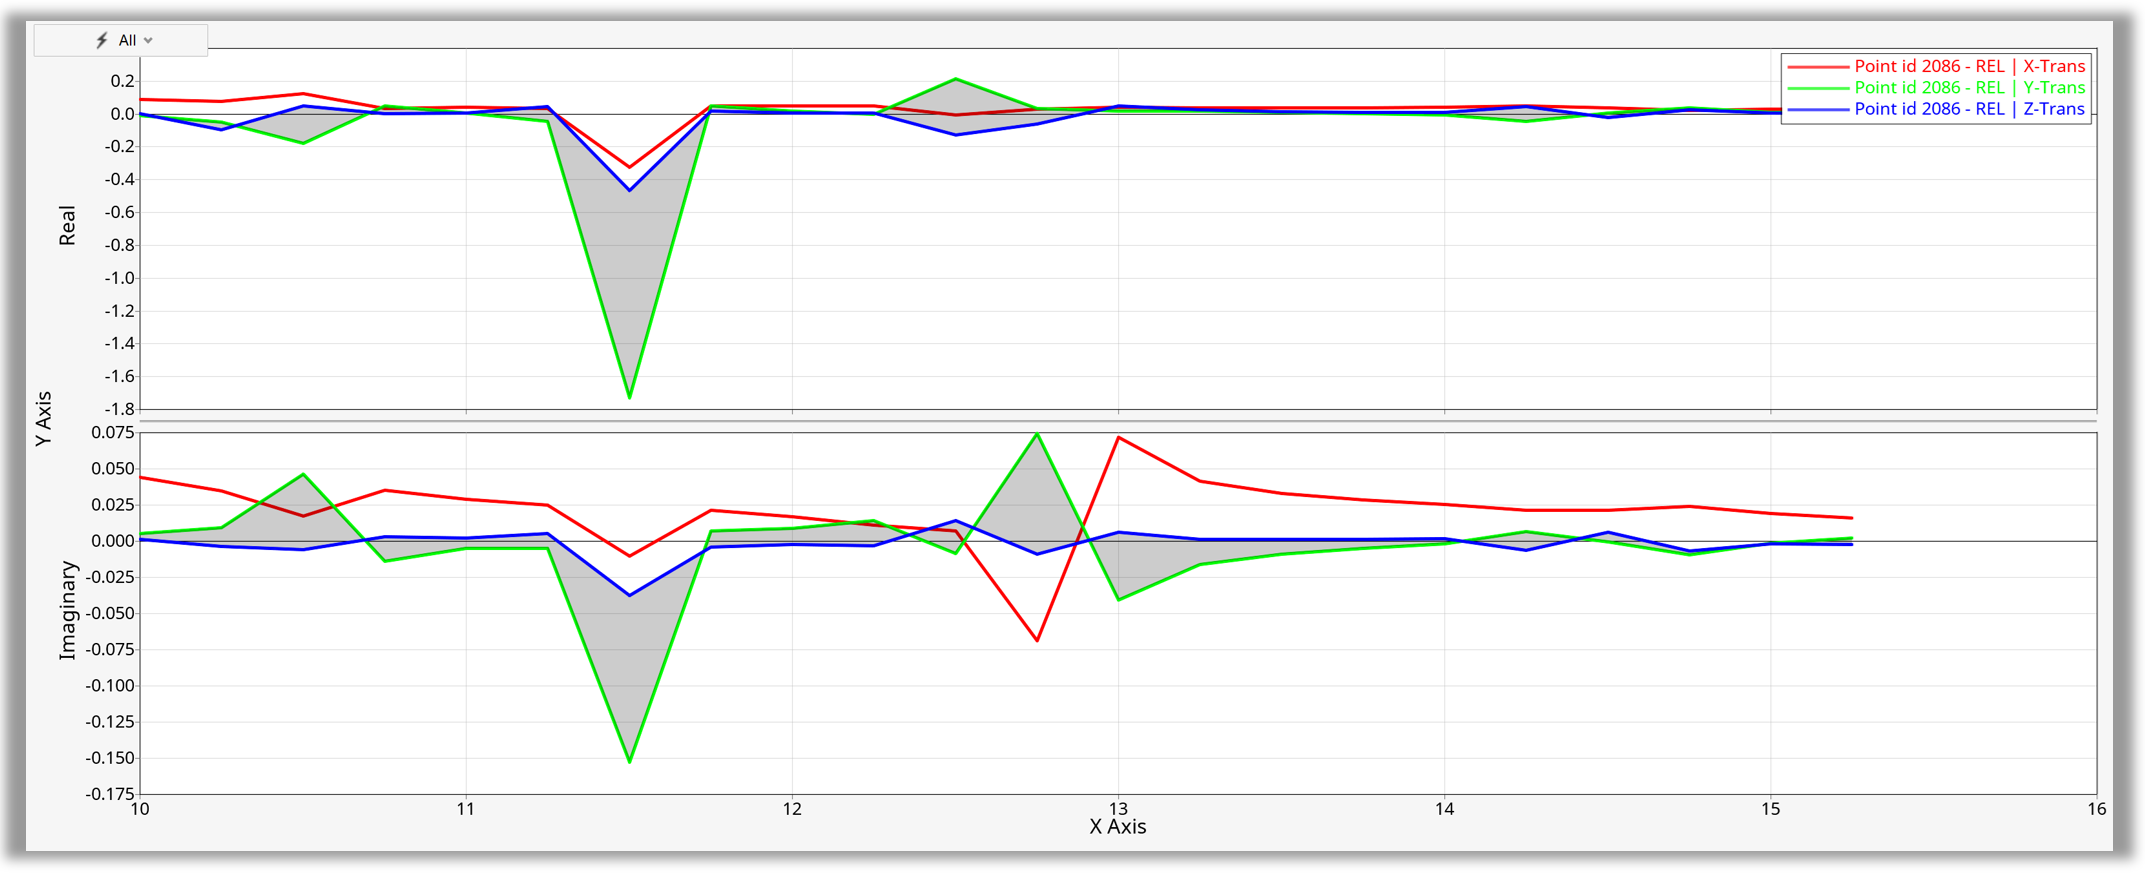
Figure 3. Creating complex curve from file
Example 04 - Bar Charts#
Creating bar charts with CurveBar() constructor#
 1import hw
 2import hw.hg as hg
 3import os
 4
 5ALTAIR_HOME = os.path.abspath(os.environ['ALTAIR_HOME'])
 6plotFile    = os.path.join(ALTAIR_HOME,'demos','mv_hv_hg','plotting','madymo','ANGACC')
 7
 8ses = hw.Session()
 9ses.new()
10win = ses.get(hw.Window)
11
12win.type = 'bar'
13
14win.barCategoryValues = ([*range(1,20)])
15win.barSetCategoryValue(1,['A','B','C','D','E','F','G'])
16
17win.barGap = 10
18win.barStyle = 'stack'
19win.barCategoryLabelAngle = 'diagonal'
20win.barLabelVisibility = True
21win.barLabelFormat = 'fixed'
22win.barLabelPrecision = 0
23
24# Layout and channel settings
25colorList   = [(255,0,0),(0,0,255)]
26requestList = ['50th% Hybrid3   - LOWER TORSO','50th% Hybrid3   - UPPER TORSO']
27prefixList  = ['A','B']
28
29# Loop over curves, notes and datums
30for color,request,pf in zip(colorList,requestList,prefixList):
31
32    bar = hg.CurveBar(yFile=plotFile,
33            ySource='file',
34            yDataType='Angular Acceleration',
35            yRequest=request,
36            yComponent='Res. ang. acc.',
37            lineColor=color,
38            label=request,
39            showPrefix=True,
40            prefix=pf,
41            yOffset=20)
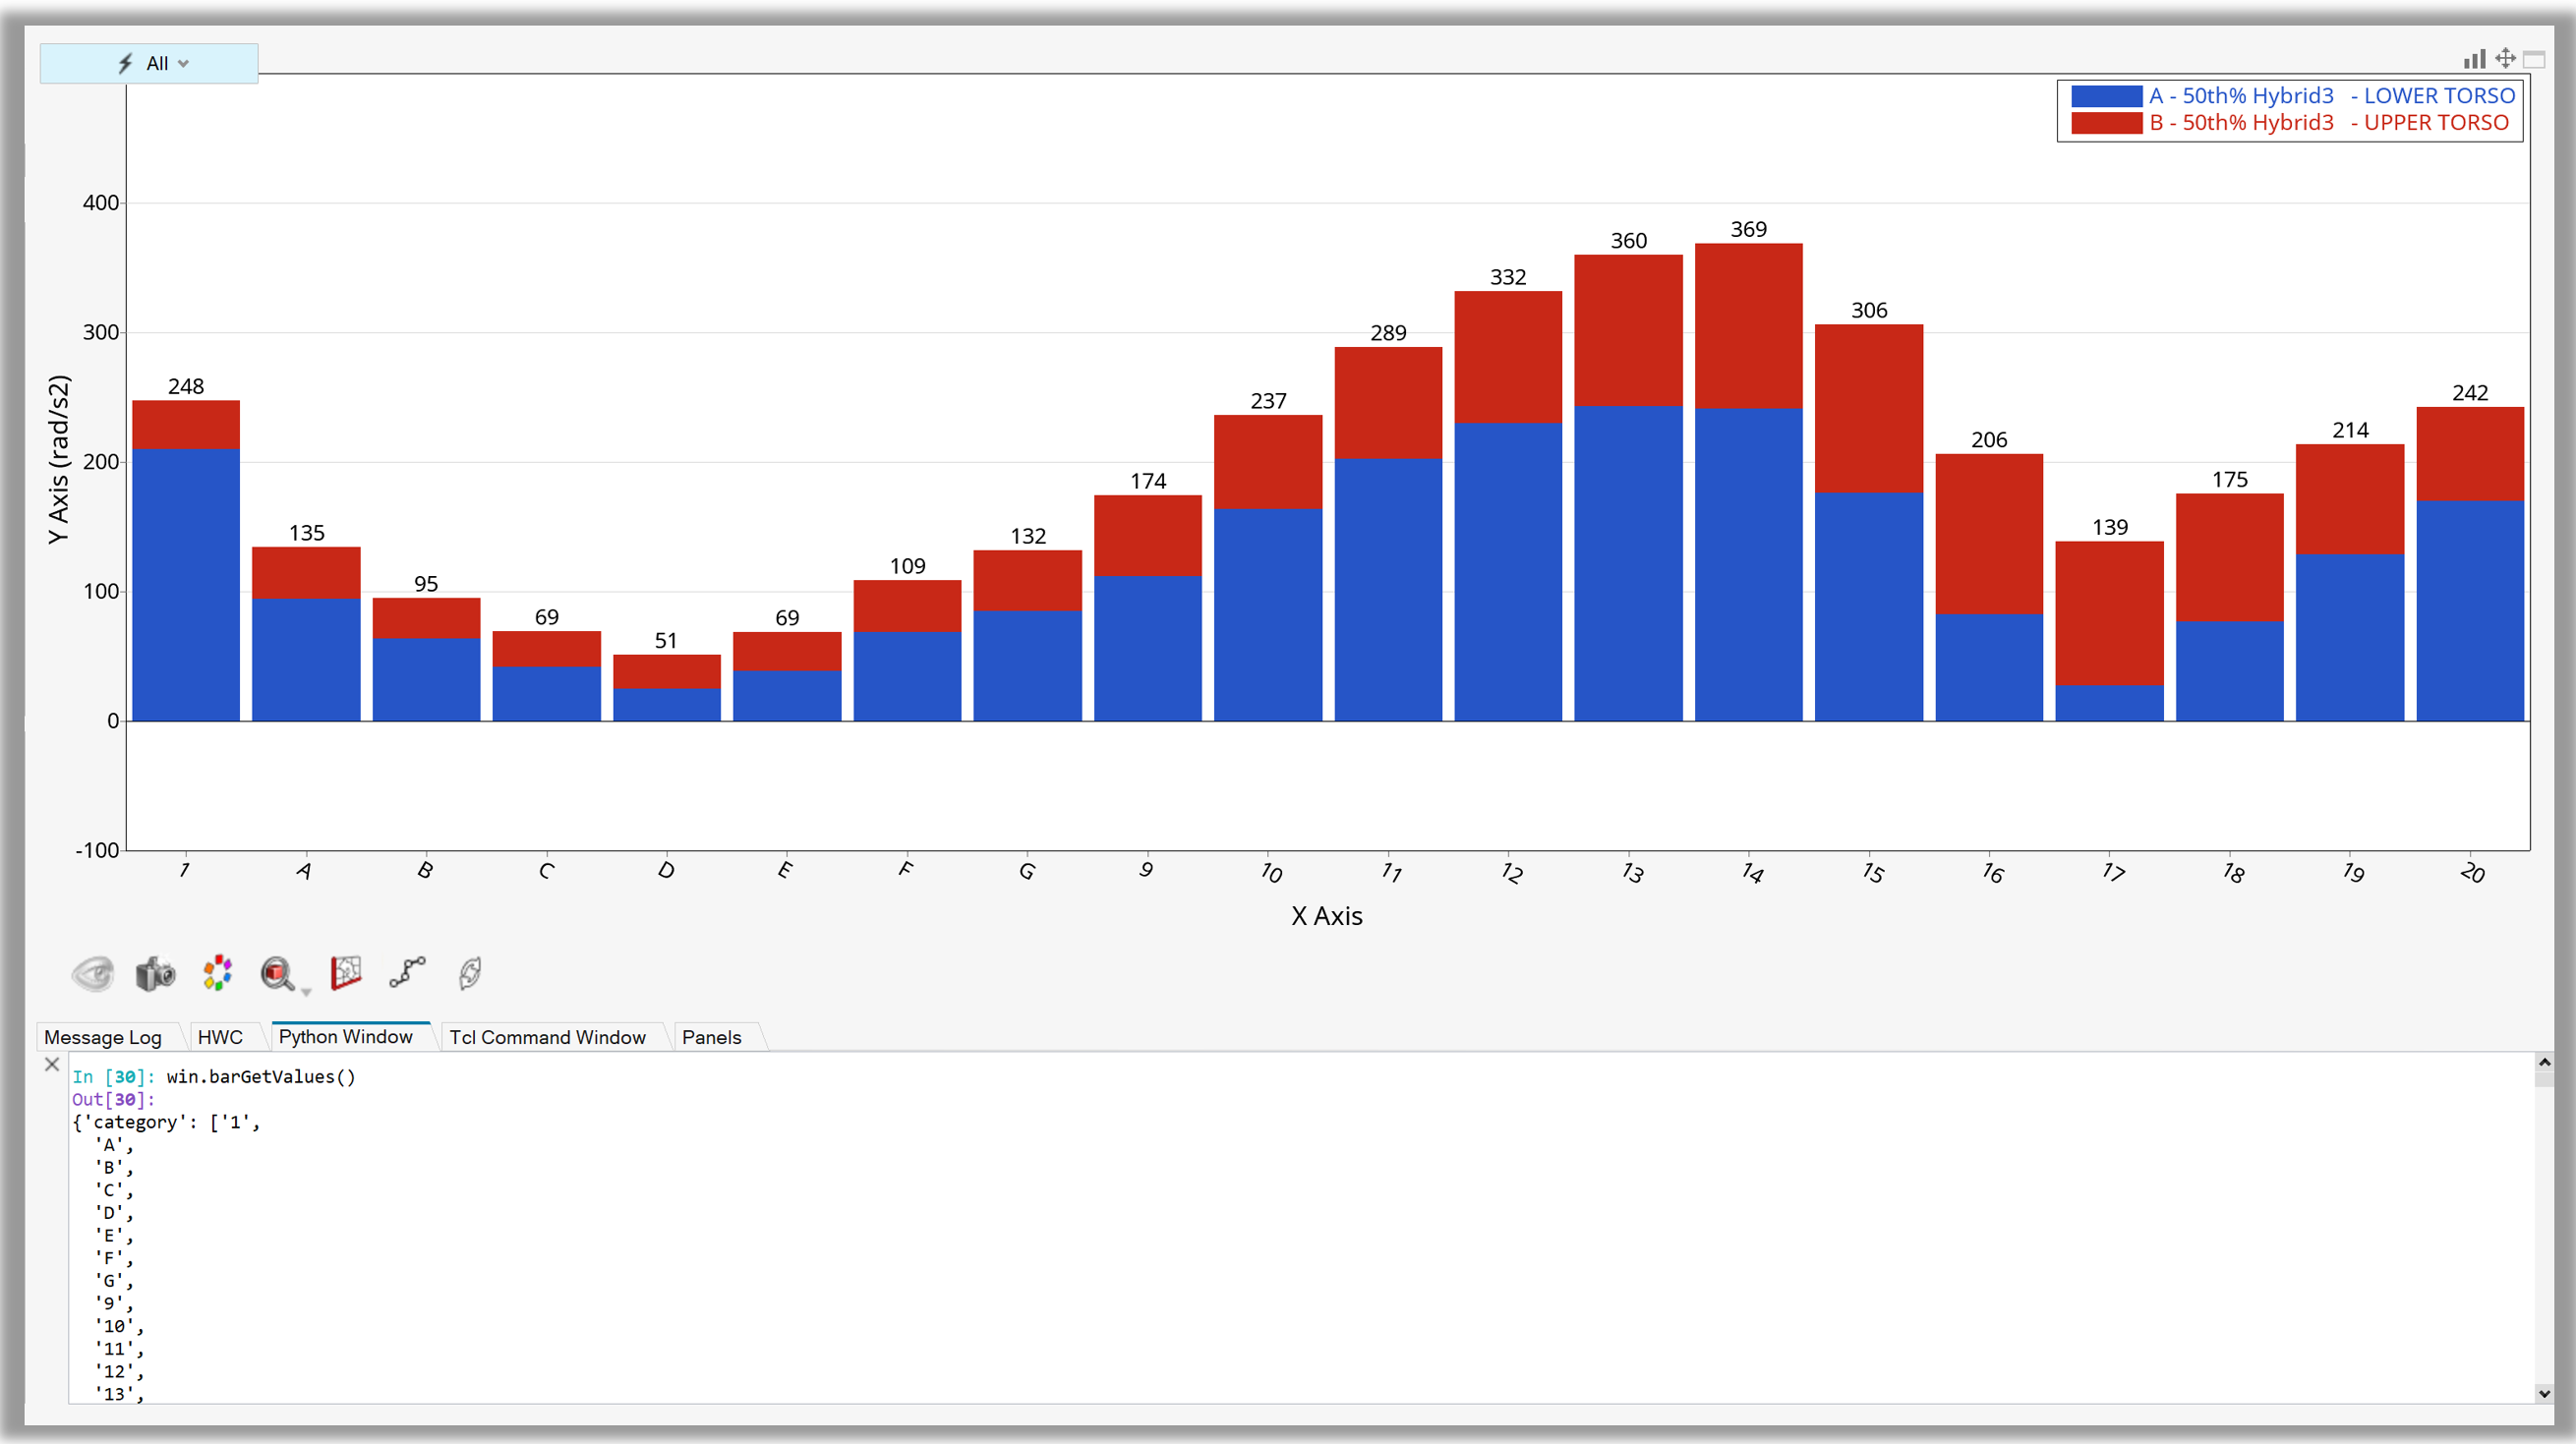
Figure 4. Creating bar charts from file