Plots
New Features
- Chart Manager
- In HyperMesh, you can now plot charts using the Chart Manager. From the Post ribbon, select the Charts tool to access the Chart Manager.
-
Figure 1. 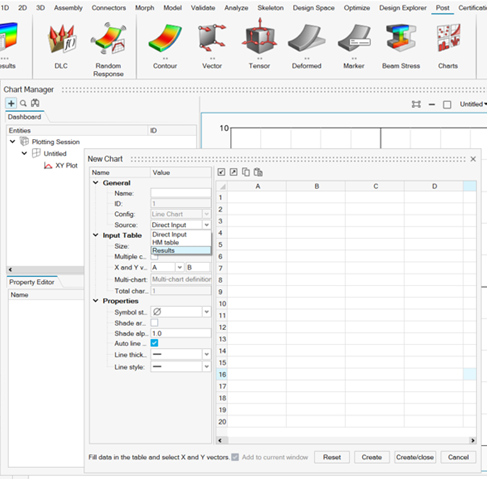
Resolved Issues
- Issues with the Chart entity.
Known Issues
The following known issues will be addressed in a future release:
- The Chart entity is only supported in the Abaqus, ANSYS, Nastran, and OptiStruct profiles.